Dwarf Fortress GDP
A number of years ago, I wrote this post. I made a category tag for it, but haven't put anything else into that category—until now.
Introduction
Dwarf Fortress is an iconic computer game. In it, the player directs a group of dwarves to dig into the ground, mine rocks and minerals, and construct a fortress. It is completely open-ended so it has no way to win (but lots of ways to have "fun"). Its graphics are extremely sparse, using coloured unicode characters to represent everything (dwarves are smiley faces, for example). But under the hood, it runs a very detailed simulation (to the extent that some players build working computers in their fortresses). And even though the graphics are 2D, it provides a fully 3-dimensional world (you can move the display through layers of dirt and rock using the < and > keys).
I'd describe Dwarf Fortress as a fantasy mining simulator (it defines over 80 different kinds of rocks) that subtly encourages players to eventually—if they can last long enough—delve "too greedily and too deep". It has been frequently imitated, but, in my opinion, never quite equalled. I think the simplicity of the graphics and steep learning curve engages players' imaginations more than more polished and user-friendly games.
It'd been a few years since the last time I played, but over the holidays I started a new fortress. With its detailed simulation, the game lets you check the total wealth of your fortress at any time (by pressing z to see the status screen). I kept a record of the wealth of my fortress as it developped because I thought it could make for an interesting illustration/exploration of some concepts in economics.
If you want to give this game a try, I recommend reading this guide. It includes a useful flowchart for building the basic elements that most fortresses need.
Narrative
"Strike the earth!", says the opening message. Initially, there is no fortress, just 7 dwarves and a wagon full of supplies. The dwarven calendar consists of 4 seasons of 3 months of 28 days each. I built my fortress for 3 years of in-game time. The following figure shows my fortress at the end of the third year. Its animation switches between the surface and the first eight underground layers (the mining tunnels continued down to 40 layers below the surface where some caverns were found). I added some labels of key areas of the fortress, too:
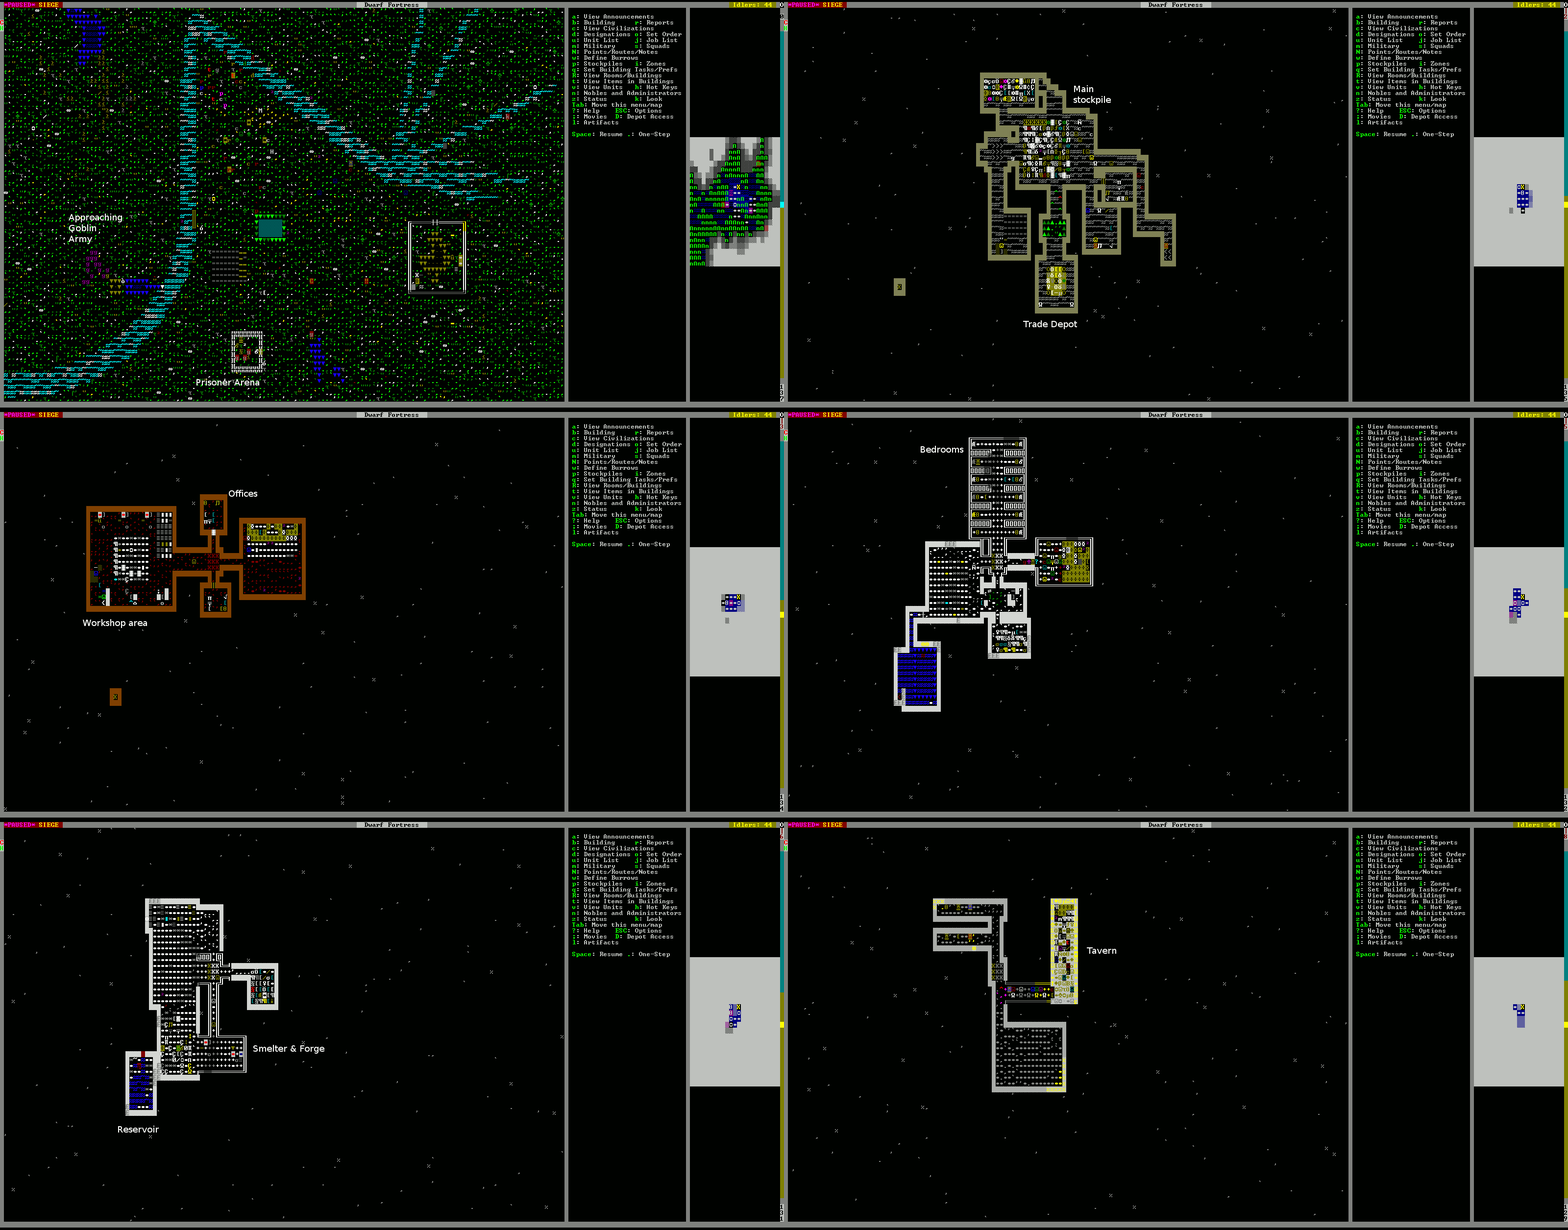
On the surface, you can see a goblin army (the group of purple gs) that has arrived to besiege the fortress. There is also a pallisaded arena—goblin thieves that skulked in one-by-one often got captured in cage traps, then I had them chained in the arena for my military squads to practice on.
Down in the heart of my fortress, you can see a water reservoir. There is a shaft leading to the surface and a flood gate connecting it to the river. I used the flood gate to fill the reservoir, but left it open a bit too long. The water actually overflowed through a well shaft (this illustrates how detailed the simulation is) and flooded a higher level of my fortress. At least one dwarf died in the flood; because I didn't bury him properly*, he came back as a ghost.
*In the time that I've spent playing DF, something I've never fully gotten the hang of is garbage management and related stuff like proper burials.
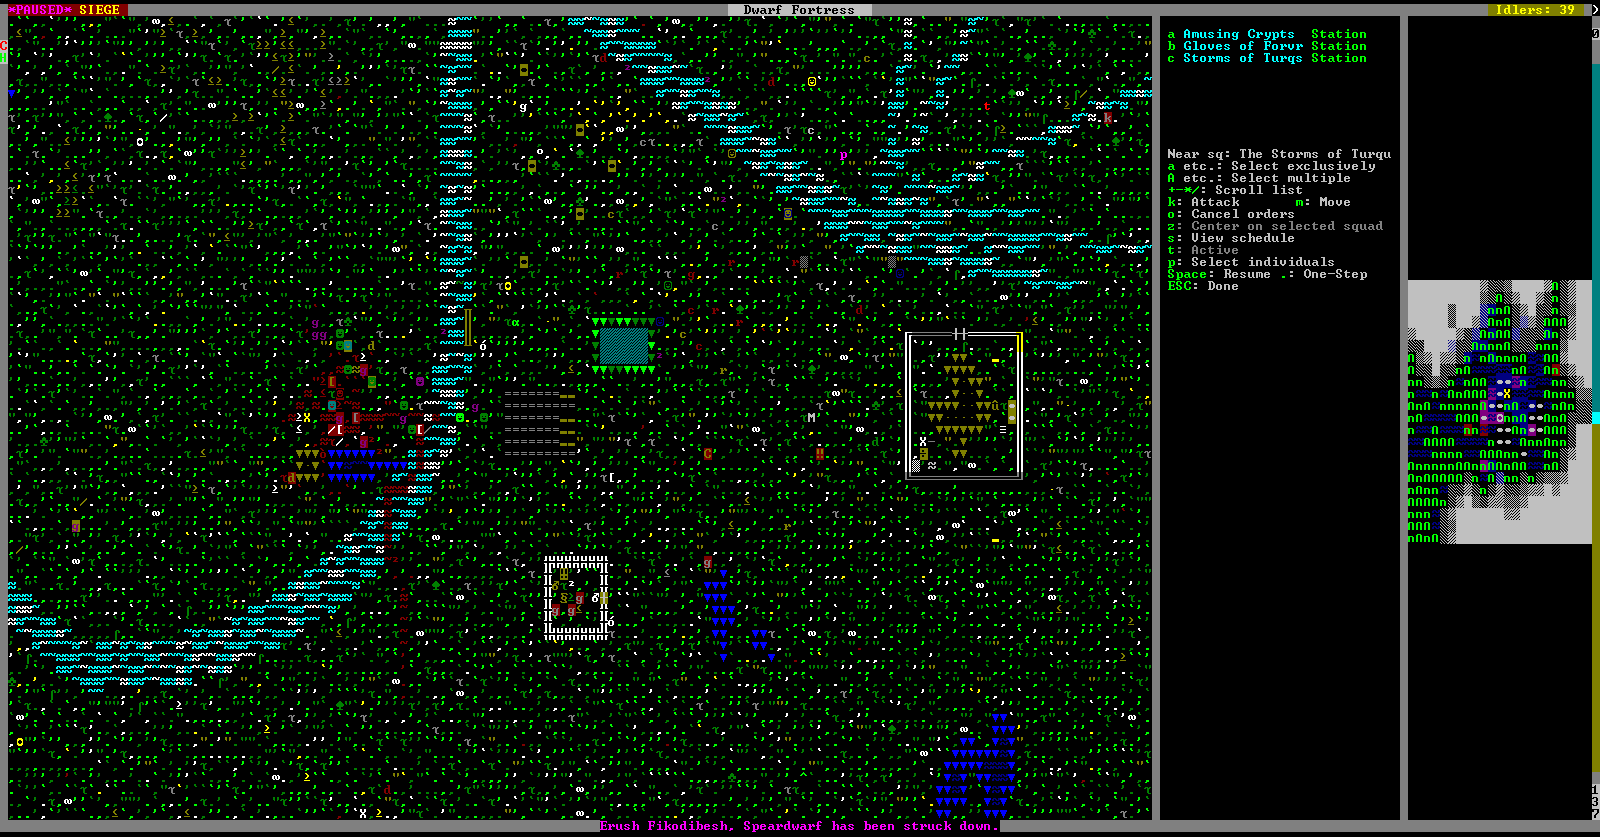
As I mentioned, at the end of year three a goblin army (totalling 16 invaders) arrived for a siege. I fought them off at the start of year four (not included in the data below), but at the cost of 9 soldiers. Here is the aftermath of the battle:
Results
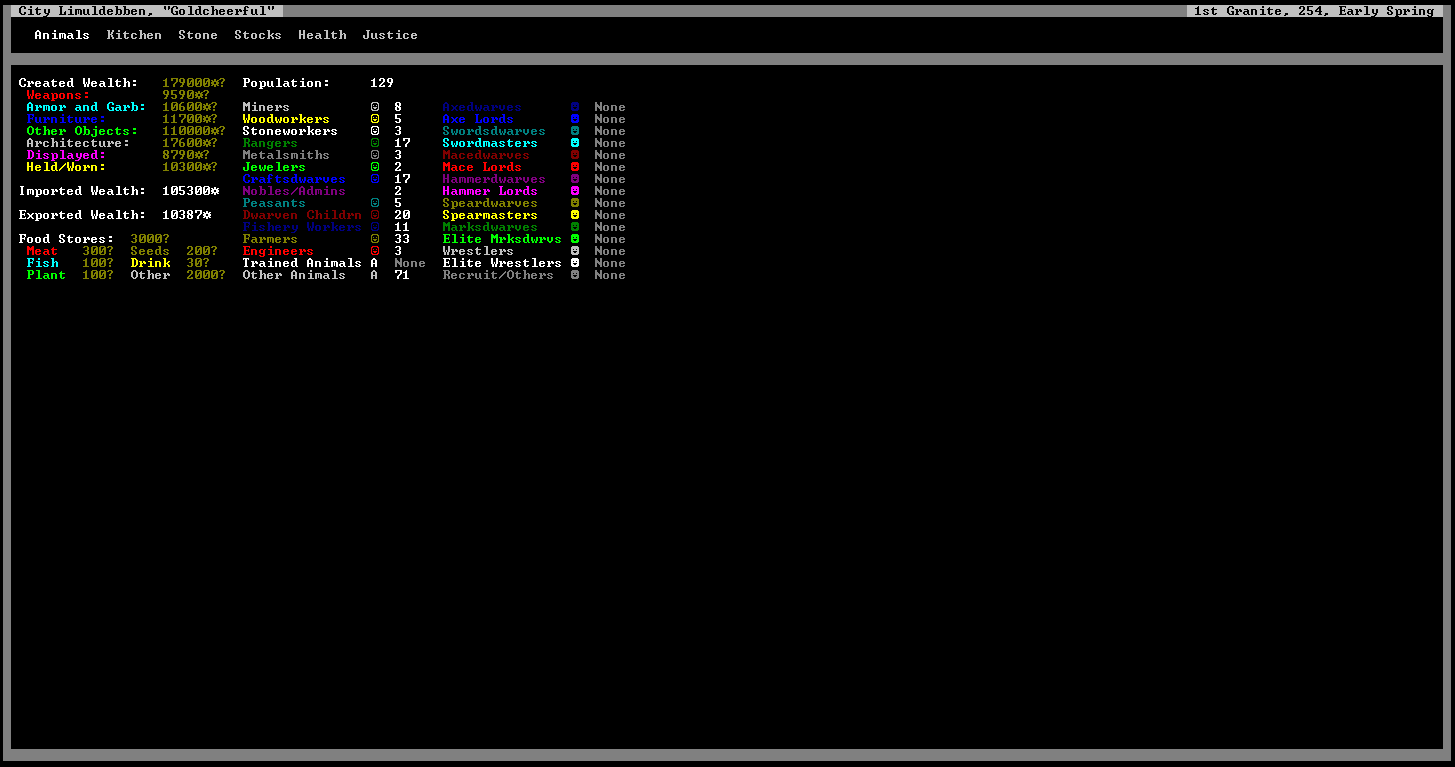
The following screenshot shows my fortress' status at the end of year 3. The wealth created in my fortress reached a total of 179,000 ⚙ (⚙ is the dwarven currency) while the imported wealth was 105,300 ⚙ and the exported wealth was 10,387 ⚙. I had a population of 129 dwarves along with 71 livestock. The stockpiles of food and drink were 3000 and 30, respectively.
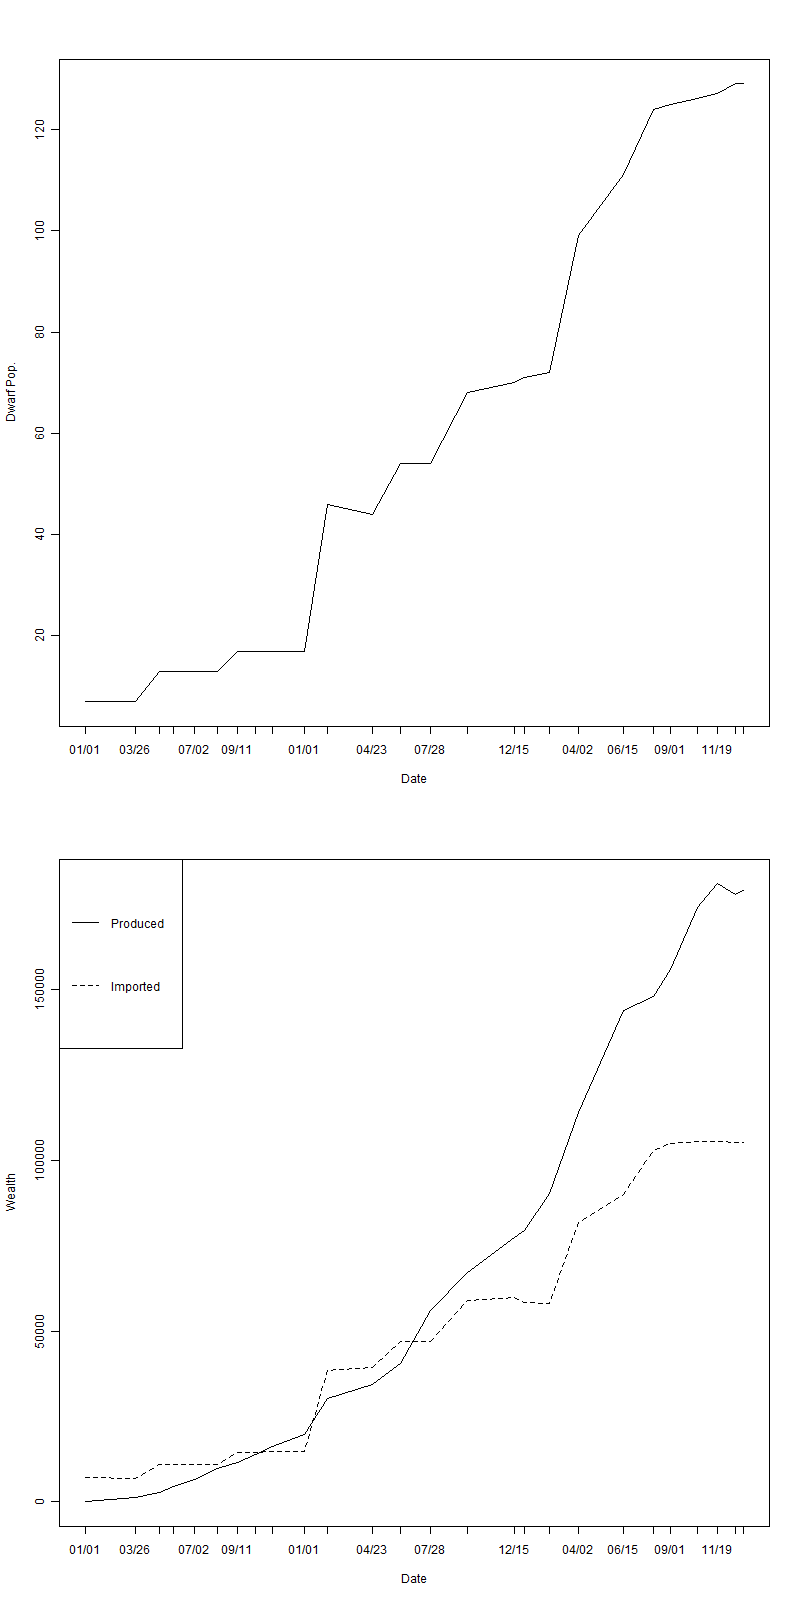
While I was playing, I checked the status screen periodically and recorded the wealth, population, and corresponding in-game date. The following graphs show how the population of my fortress and its total wealth developped over time. The dates are listed as month/day. The population grew mainly through immigration, although children started being born sometime in the second year if I recall correctly. The imported wealth mainly comprised the possessions immigrants brought with them, although it also includes goods traded for (totalling less than the 10,387 ⚙ that was exported) and items seized from would-be thieves. A notable fact about the produced wealth is that occasionally a dwarf will be seized with inspiration/madness and make a valuable artifact in a workshop. After 3 years, my fortress had 5 artifacts totalling 38,520 ⚙, which represents more than 20% of the wealth produced during that period.
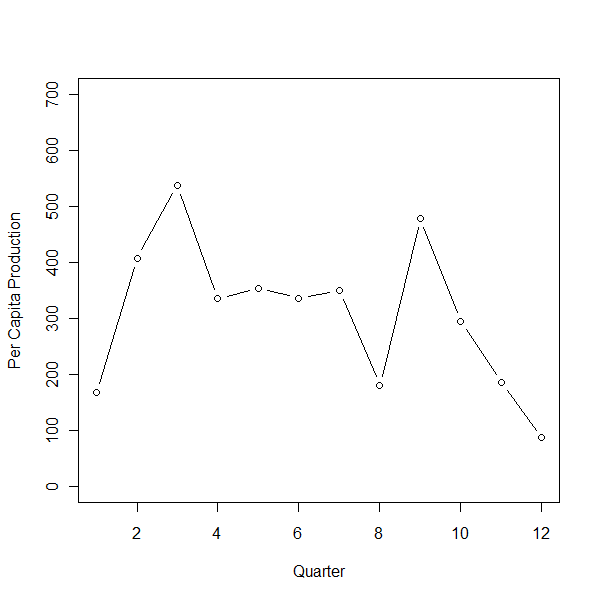
The next graph was made by looking at each season/quarter and dividing the change in fortress wealth during that period by the average population during the same period. It shows the per capita (per dwarf) rate of value-added production and how it varied over time. In spite of the title, this isn't exactly the same thing as GDP, as discussed in the subsequent section.
Discussion
GDP can be calculated in a few different ways. One is as the gross value added. Another is the sum of consumption (which can include goods kept in inventory for future consumption), investment, government spending, and net exports. By tracking the fortress' wealth over time, I was only capturing the value-added portion, since intermediate goods used to make something else would be removed from the overall tally. So the graph above mostly reflects the former calculation method (the total wealth on the status screen was conveniently separated into "created" and "imported" portions already). What's missing is that it only captures the production of durable goods: for example, food that gets eaten is clearly part of value-added production, but it wasn't accounted for in my graph; additionally, the service economy wasn't included. In the real world, these would be big omissions, but dwarven industries heavily focus on the production of durable goods. In fact, the dwarves are described as "short, sturdy creatures fond of drink and industry." Regarding the consumption of food and drink, dwarves need 2 units of food and 4 units of drink per season. If this need was satisfied with wine and cheese (both of which were available in my fortress, although the wine came close to running out a couple of times) the associated value would be 28 ⚙ per dwarf—so around 10% extra GDP per quarter than I calculated. Regarding the service economy, the main jobs in that sector were a few dwarves assigned (part-time) to administrative tasks (like bookkeeping) and a few squads of soldiers. Maybe around 15% of the workforce was in such jobs, so that could serve as a first approximation of the size of the dwarven service economy.
The latter calculation method for GDP mentioned above can also shed some light on what is and isn't included in my analysis. Outright consumption was minimal, but the increasing sizes of stockpiles can be counted under that category. The wealth of the fortress includes its architecture, so investment was captured in my analysis. The service sector in the fortress relates to government spending, and as I've discussed already it can only be roughly estimated. Net exports were low (I traded 10,387 ⚙ to visiting caravans but received almost as much back in exchange) and all imported goods (which mainly were the possessions that came with migrants) were left out of the final graph anyway.
In the final graph, the per capita quarterly (equivalent to seasonally) production (excluding the service sector and consumed food and drink, as discussed) increased initially then settled to a fairly steady rate of approximately 350 ⚙ before oscillating then starting a decline. To wrap this post up, I'll offer some interpretation of the trends and discussion of relevant economic concepts:
- The dip at the end of year 2 was mainly due to my attention starting to drift. So I took a break from playing and when I came back I reviewed the work that some of the dwarves were eligible for and also queued up a bunch of work orders in the various workshops around the fortress. This explains the spike in productivity at the start of year 3. Therefore, I think the oscillation at those times could have been smoothed out somewhat.
- So I think the most significant trend is an initial rise in productivity, a period of declining productivity at the end, and a fairly steady period in the middle.
- Factors that increase productivity are expertise of the worker and capital investments. I think both of these factors were at play to increase the productivity over time. The dwarves gain experience as they do tasks (so it makes sense to divide the labour assignments as much as possible and let at least some of the dwarves become specialists in high-value tasks) which increases their output. Capital investments in my fortress included building workshops so that dwarves had space and equipment to manufacture a wide array of goods as well as digging deeper mineshafts to levels with more valuable minerals.
- I think a big factor behind declining productivity in year 3 was the growing population and complexity of my fortress. Dwarves take some initiative to do things like replant crops or go fishing without being told, but for the most part the fortress operates as a command economy: I have to designate areas to be mined or items to be produced at a workshop. Centralized/command economies have significant coordination problems as they scale up. By the time the population of my fortress was over 100, there were often 40 dwarves or more that had no jobs to do because I hadn't assigned anything they were eligible for, or because necessary raw materials weren't available.
- In the third year, I also tried to increase my military strength, so some of the apparent decline in productivity is simply due to the service sector (which mainly consisted of soldiers) not being accounted for. Additionally, part of the population was children by this point in time.
- Although much of the wealth of my fortress was initially dug out of the ground, there was a lot of value-added from various processing steps. This page gives an example of how the value of tetrahedrite (a mineral my fortress had in abundance) can be increased over 90 times by smelting it then forging axes.
- I noted above that over 20% of the wealth of my fortress came from five artifacts. This exceeds my estimate for the contribution of the entire service sector.
- Even though this is a fantasy game, I believe that the preceding two points have parallels in the real world. Natural resources get upgraded again and again as they move through the supply chain. I don't believe that finite resources have to pose a firm constraint on economic growth as long as more valuable and more efficient uses for them can continue to be found. While "artifacts" aren't a big part of our economy, we've seen numerous examples in the past decade of how a spark of inspiration (in the right place at the right time) can quickly become a billion dollar company.
- It's important to keep in mind the difference between stock and flow variables. The information available on the Dwarf Fortress status screen is the wealth at a single instant in time—a stock variable. GDP is a flow variable. Moving from one to the other is not a trivial task. I've tried to use the data I recorded and make some reasonable assumptions for the rest.
- Finally, I think this quote from Seasteading is a good summary of the limitations of GDP as a metric:
Real GDP per person is a blunt instrument to measure overall quality of life, because GDP lumps together all financial transactions. If you get beaten and mugged, the costs of your health care, having to replace your mobile phone, and the policing that fails to catch the criminals are included in GDP. The Good Samaritans who chase away the muggers, notify the neighbors, and offer to babysit your kids while you’re in the hospital are not included in GDP. Also, the painkillers you purchase on the down low from your brother-in-law and the pet sitter you pay under the table are not included