NB Budget 2021: Damage Report
When I wrote last year's version of this post, the Coronavirus pandemic was just becoming apparent in North America. Since then, most of us have obviously had our expectations for 2020 disrupted, and public finances were no exception. In this post, I want to compare what was planned for the past year in the New Brunswick provincial budget with what actually happened, as well as with the government's plan for the year ahead.
To start with, here are my usual explanatory notes: I try to keep most of the amounts in millions (M) of dollars (CAD) because I think it's easier to compare than mixing million and billions. And while I'll mostly refer to it as the 2021 budget, it is technically for the 2021-2022 fiscal year.
In the post below, I'll review the numbers from the new budget (with special attention to the differences between the 2020 budget and the revised numbers now that we're at the end of the fiscal year) then I'll try to briefly summarize some of the impacts from the coronavirus pandemic. Despite the allusion in the title, New Brunswick has weathered the pandemic better than a lot of places, not only in health outcomes, but also with respect to the economic impact. For example, the unemployment rate here is currently less than the Canada-wide average (8.9% vs 9.4%). Finally, I'll give an update on the province's demographic trends, which was the theme of my post last year.
Updates on Expenditures and Revenues
To start with, here are some of the key estimates in the provincial budget for the fiscal year ahead:
- Projected total revenues of $10381M
- Projected total expenditures of $10625M
- A projected deficit of $245M
- Projected net debt of $14132M this time next year
According to the budget document, the net debt by the end of the fiscal year will represent around 36% of GDP. The Canadian federal government's debt-to-GDP is around 63%, so the combined liability to taxpayers is close to the psychologically-significant 100% of GDP mark. It's also interesting to look at the debt load per capita. In NB, this is $17,600 (provincial debt only); quite a few provinces are higher than this, although some have stronger economies to go with it: MB, AB, QC, NL, and ON.
The departments with the largest budgets for the upcoming fiscal year are as follows (these figures and the following graph are for their ordinary accounts which don't include capital spending, amortization, etc.):
- Health: $3071M
- Education and Early Childhood Development: $1411M
- Social Development: $1367M
- General Government: $930M
- Post-Secondary Education, Training, and Labour: $669M
- Debt Service: $655M
- Transportation and Infrastructure: $330M
- Public Safety: $310M
On the revenue side of the 2021 budget, the major anticipated sources of revenue for the Government of New Brunswick include:
- Taxes: $4786M
- Equalization Payments: $2274M
- Other grants/transfers from the Federal government: $1556M
- Other self-generated revenue (Licenses, Royalties, Lottery, Etc.): $1234M
Note that the taxes are spread among a number of categories (income, sales, property, corporate income, gas, carbon, tobacco, etc.). Equalization provides around 22% of the revenue to the province's coffers.
The following pair of graphs show the budgeted expenditures by department and the budgeted revenue by source. For the past year (which was notably abnormal), I've graphed last year's budgeted amounts (blue), the revised totals at the end of the fiscal year (orange), and the budgeted amounts for the fiscal year ahead (grey). They are shown on a logarithmic scale so that relative changes show up better.
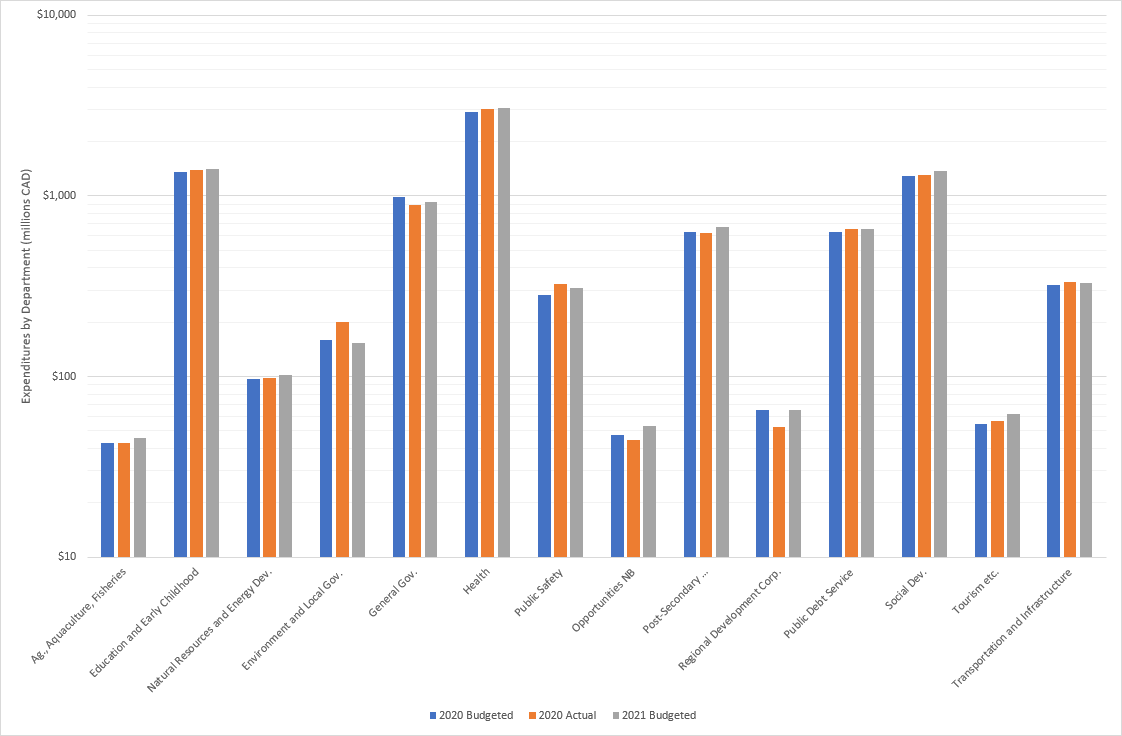

Looking at these graphs, the first thing I want to discuss is how the pandemic affected spending and revenue compared to last years' budget (which came out just a couple of weeks before restrictions were imposed). On the spending side, some departments had more work to do and thus higher expenditures. Others may have had savings from not having facilities open or not being able to run programs like usual. The Legislature (not shown on the graph as it isn't a major department) had a 25% ($8M) increase in spending, which I assume was due to costs associated with virtual meetings along with extra safety precautions for in-person meetings. The department of Environment and Local Government got around $40M extra last year for administrative support for local governments; this was a one-off supplement in response to the pandemic. Other departments that got Covid-designated funding added on after the main budget came out were: Health ($134M), Public Safety ($42M, which I assume included paying for peace officers at points of entry to deliver quarantine orders to arrivees), and Social Development ($20M - this is the department responsible for long-term care homes). The 2021 budget includes a continuation of this funding for pandemic operations, but at a reduced amount (around half, which might be a guess at how long into the upcoming fiscal year these added operational costs are expected to be needed).
Despite the drastic disruptions in society last year, most departments only had a difference of a few percent between what they were budgeted and the revised numbers at the end of the fiscal year. This illustrates the inertia of the ship of state.
The revenues from the biggest taxes (income tax and HST) were down 5% last year from what had been expected—because residents of New Brunswick were earning less and spending less due to the pandemic and associated restrictions—and they aren't expected to recover to the levels budgeted for 2020 in 2021. Personal income tax revenue is expected to be even lower in 2021 than the actual amount received in 2020, I assume because it is influenced by how much someone made in the previous year.
In the 2020 fiscal year, declines in tax revenue were more-or-less offset by one-time increases in transfers from the Federal government designated for fighting the pandemic. The notable line items were $219M for the "Safe Restart Agreement" and $40M for the "Safe Return to Class Fund".
For the 2021 budget, there are modest but real increases (4.4-6.3%, so around 5% each) to spending on health, education, and social development. These four departments (post-secondary education is in a separate department from K-12 education) have a combined budget increase of almost $330M. This is in a year when revenue growth is basically flat: there is a 1% increase in the overall revenue, but that is mainly due to special agencies/accounts and the ordinary account revenue is actually down by $4M.
Pandemic/Response Impact
At the time of writing, the pandemic has claimed 30 lives in NB. This is under 4 per 100,000. To put this in context, the number of deaths from all causes the year before was 7,945 (equal to 1,017 per 100,000). So the Covid-19 pandemic has caused less than 0.4% of the number of typical annual deaths here. Looking at our neighbours (outside of Atlantic Canada, which has been fairly similar), the death rate so far from the pandemic per 100,000 people has been 124 in Quebec, 53 in Maine, 87 in New Hampshire, 33 in Vermont, and 236 in Massachusetts (US data from CDC). Maine and Vermont had the two lowest rates in the US, so being an out-of-the-way place with a low population density certainly appears to be an advantage when it comes to avoiding the worst of the pandemic. The hardest-hit US state was New Jersey, with 266 deaths per 100,000 people. It's hard to say how much different policies—rather than just lower density and more geographic isolation—led to Atlantic Canada having a lower direct impact from the pandemic compared to these other jurisdictions. When speaking of differences in policies, the main thing that stands out is effective control at the border (including quarantines for people who do need to travel), since other jurisdictions have also promoted/mandated mask-wearing and had lockdowns (Quebec even has had curfews). To the extent policies (rather than geography or luck) have kept NB from being as hard-hit as Quebec, we can estimate they've saved (well, extended) hundreds (but not thousands) of lives.
Along with its toll in lives and sickness, the pandemic and/or the restrictions brought in to fight it have had an economic impact. In the previous section, I pointed out how provincial revenues fell short of expectations, largely because citizens and residents were earning less and spending less. Of course, this affects not only public coffers, but the broader provincial economy.
The finance department has a nice dashboard website showing a variety of indicators on the provincial economy. Here are a few that are especially interesting:
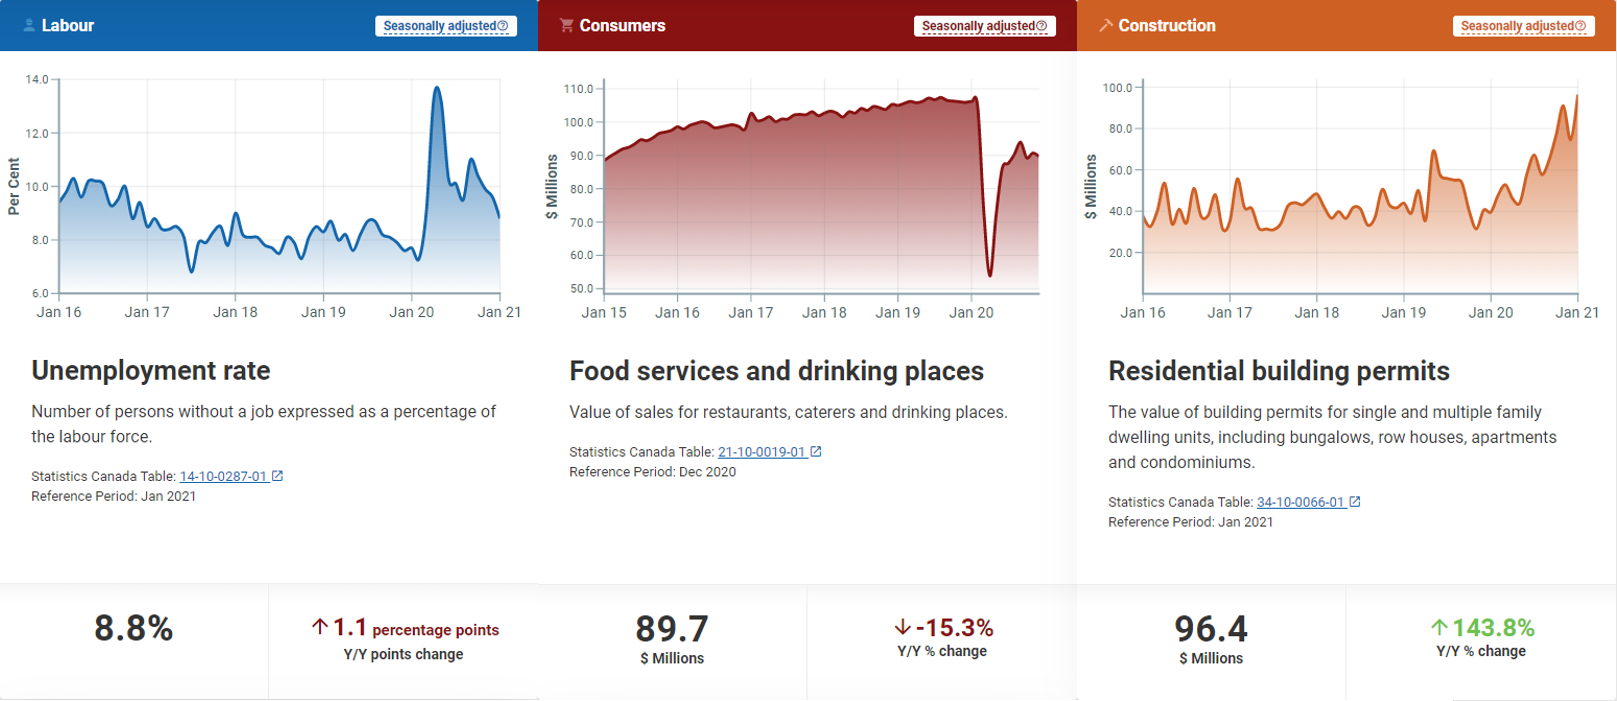
The unemployment rate is currently at 8.9% (it changed slightly since I collected these screenshots), compared to a pre-Covid baseline of around 8%. However, it's generally been dropping from month to month so hopefully will be back to normal (or better) soon. It reached a high of over 13% in April and May of 2020. Another tile in the dashboard shows that workers' (i.e. only counting employed people) average monthly earnings increased 6.5% in April 2020, which indicates that most of the layoffs were concentrated in low-wage jobs. Total wages and salaries paid in NB by month were $1314M in May 2020 (which was the lowest since Oct. 2017), but had climbed to $1450M in December 2020. This is 1.7% higher than a year earlier, so can be seen as a modest sign of recovery.
Restaurants (from the middle tile shared above) still have monthly sales 15% lower than a year ago (just before the pandemic). While the worst trough was short-lived, this sector of the economy is still far from being fully recovered. In contrast, retail trade (not shown, but the tile can be seen on the linked dashboard) was 5% higher in December 2020 compared to a year prior. Looking at another sector of the economy, domestic exports are also down (11.6% year-over-year in January 2021), but there is a lot of variability/noise in this graph anyway; for example, there was a drop in the fall of 2018 of around the same magnitude as the spring of 2020 at the start of the pandemic.
Building permits (the tile on the right) are clearly booming, at least for residential construction. This statistic might include renovations (I'm not sure), but building starts are also up. A couple of posts ago, I noted high lumber prices. The high demand associated with all of this residential construction is surely a contributor to that.
In the next section, I'll have more to discuss about population trends, but I wanted to pull a couple of stats from the dashboard here. Out of the past 20 quarters shown, seven of them had a natural decrease (deaths exceeding births) of over 400. This is a consequence of an aging population and below-replacement birthrate. The highest natural decrease in a quarter was 645. However, 14 of the past 20 quarters had a net migration (immigration plus people moving from other parts of Canada minus people moving out of the province) greater than 645, so this offsets the natural decrease and allows for a modest growth. The current population of NB is now over 782,000 people.
This is a numbers-driven post, but I don't want to leave this section without acknowledging the non-quantifiable impacts that the pandemic and the restrictions brought in to fight it have had on individuals and households across the province. People have missed being with loved ones in their final moments and have been unable in some cases to mark their grief with a proper funeral. Weddings have been postponed, or gone ahead with some special friends and family absent (as for my wife and I). Other life milestones, from birthdays to graduations, have passed with very muted celebration. Surgeries and medical tests have been delayed. Loneliness and uncertainty about the future have strained mental health for many. Some business owners have seen their hard work and dreams crumble. Vacation plans have been shelved or cancelled. And the list could go on and on. I don't have answers or solutions to these things, but I wanted to at least ensure they're not invisible when talking about the costs of the past year, in spite of not having a dollar figure attached.
Demographics Update
As I mentioned in the introduction, I wanted to follow up on the demographic realities facing New Brunswick that I discussed when last years' budget came out. I saw an article with a detailed breakdown of population changes across the province in 2020, so I used the information in it to make the following graph:
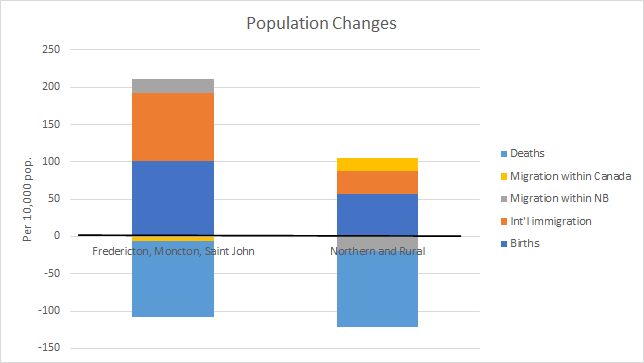
Here are some explanatory notes about this graph:
- It is normalized per 10,000 population
- These are straight averages, not weighted by the relative population of each sub-area
- The linked article stated births per 100 deaths so to separate the rates I assumed an equal death rate in each region, but that is probably an oversimplification—the lower birthrate in northern and rural areas probably indicates that the population skews older.
- This way of looking at it hides some variability: Saint John is growing at half the rate of Fredericton, and a third of that of Moncton, and Miramichi is growing while Campbellton is shrinking. However, the 3 larger cities are all above a 0.5% growth rate and everywhere else is below that threshold.
Fredericton, Moncton, and Saint John (averaged between them) have almost enough births to balance out deaths and maintain a steady population. This is not the case for northern cities (Miramichi, Edmundston, Bathurst, Campbellton) and rural regions. These latter regions also have a population drain from intraprovincial migration, which is Fredericton and Moncton's gain. However, the larger cities (on average, mainly driven by Fredericton) have more net migration to other parts of Canada. In contrast, northern cities and rural regions had net migration from the rest of Canada (people coming [back] to retire, perhaps?). International immigration is almost enough to balance out population losses in northern and rural NB, while being a significant driver of growth in the larger cities.
As I explained last year, increasing the population of New Brunswick is a good idea to maintain a workforce and tax base as more and more of the current population approaches retirement. From the analysis above, I think each region should lean into its strengths. That is, northern and rural NB should continue to try to attract migration from other parts of Canada. The larger cities should aim to keep immigration and birthrates up (and among my friends and acquaintances, there seems to be a mini baby boom going on at the moment!). A net growth rate of +150 per 10,ooo people per year across the whole province would get us to a million people by 2040. Currently only Moncton meets that, but other regions should try to get there.
There was a highlight in the press release for the budget that sounds to me like a good strategy to grow the provincial population and economy with some targeted self-promotion:
A multi-year strategic investment to establish New Brunswick’s physical presence in India and the United Kingdom to promote the province as an ideal location to invest, live, and study.
References and Relevant Links
- Main budget document
- CBC article
- Economic Dashboard
- Debt Clock (source for Federal and other provincial debt figures)
- Stats Canada analysis on aging population (See Figure 2.5 and Table 2.2)
- This article has some good insight on trying to boost the Maritime economy and population. Low housing costs are attractive now, but rising demand will tend to equalize them with the rest of the country. Tax rates that are higher than neighbouring regions are a potential obstacle to growth. But quality of life and strong local networks are a major strength.