Sim City's Laffer Curve
This post is something I originally wrote for a Facebook note a few years ago, but I'm planning to do more to explore economic concepts in video games.
Introduction
I dug out an old computer game recenty (i.e. before I originally wrote this note), Sim City 2000. Although it's a Windows game, it won't run on Windows 7; however, I got it working on my Linux laptop using the Windows emulator "Wine". After playing a couple of games for old times' sake, I had an idea: applying the Laffer curve concept to the game mechanics.
Briefly, the Laffer curve is a relationship between the tax rate and the revenue received from taxation. It explains how increasing tax rates do not provide a 1:1 return in increased tax revenue; situations can even exist where raising the tax rate reduces the revenue obtained.
Method
Figure 1 shows Sim City 2000 running on my laptop. The procedure I used was as follows:
- I loaded a saved city (Toronto) that came with the game.
- I set the tax rate to the value I was testing, while holding all other conditions constant (see Figure 2).
- Since the save file began mid-year, I let the city acclimate to the new tax rate for 6 months before taking any measurements.
- At the end of each of the next five in-game years, I recorded the revenue received from taxes in that year.
- I repeated the above steps for all of the tax rates I was testing (0-20% in increments of 3%).
- I graphed the data in R.
By always starting from the same save file and running the test over the same 5.5 in-game years, I had an opportunity that real-world economists never have, where "all else being equal" really worked. Note that the city had sufficient cash reserves such that no services suffered from lack of revenue, so the tax rate was the only thing changed. I also didn't build anything in the city while I was doing the experiments.
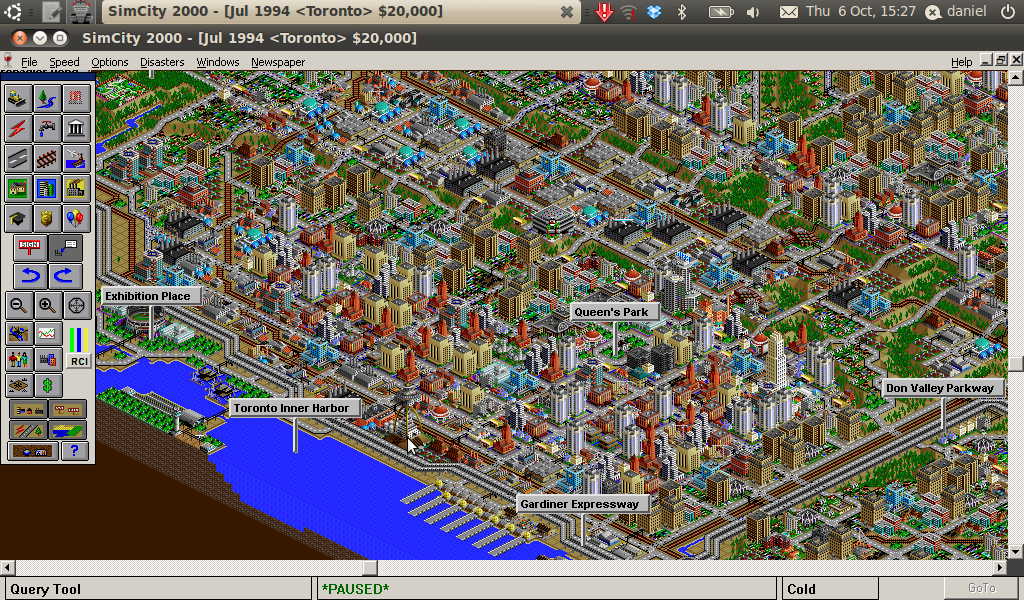
Figure 1: At the start of the experiment.
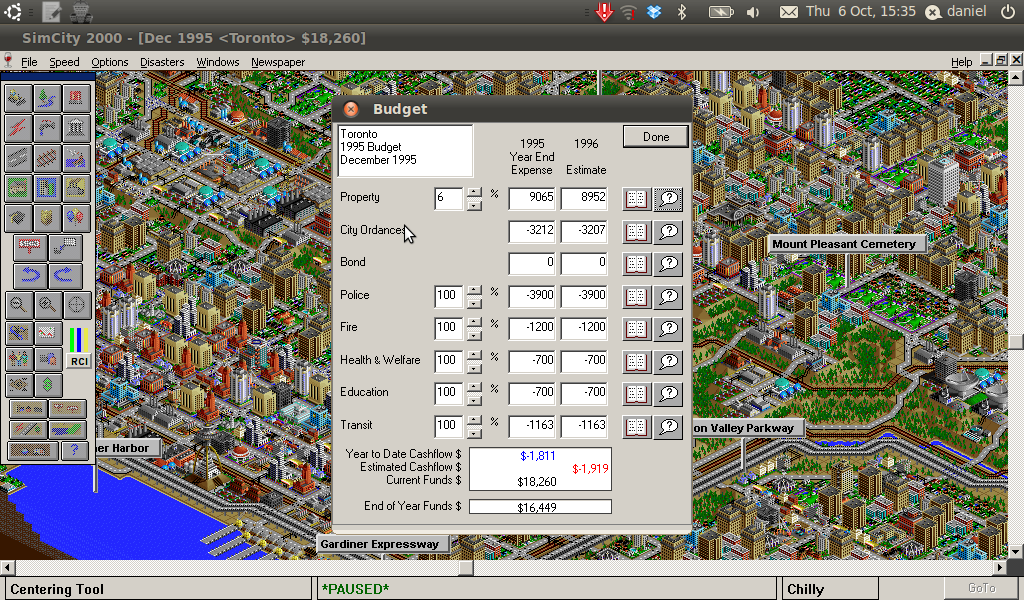
Figure 2: The budget screen where the tax rate can be set.
Results
Figure 3 shows the revenue as a function of tax rate, averaged over the 5 years of game time that I was recording it for. In this particular case, 9% appears to be the approximate maxima.
Figure 4 helps to explain these results. At a 9% taxation rate, the revenue doesn't change much from year to year. But at a 15% tax rate, it drops steeply as Sim citizens leave for greener pastures.
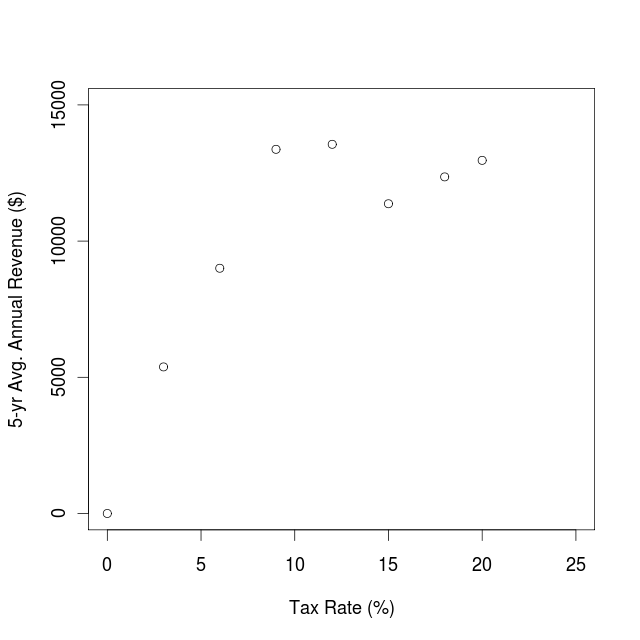
Figure 3: The average revenue over the five year experiment for each tax rate tested.
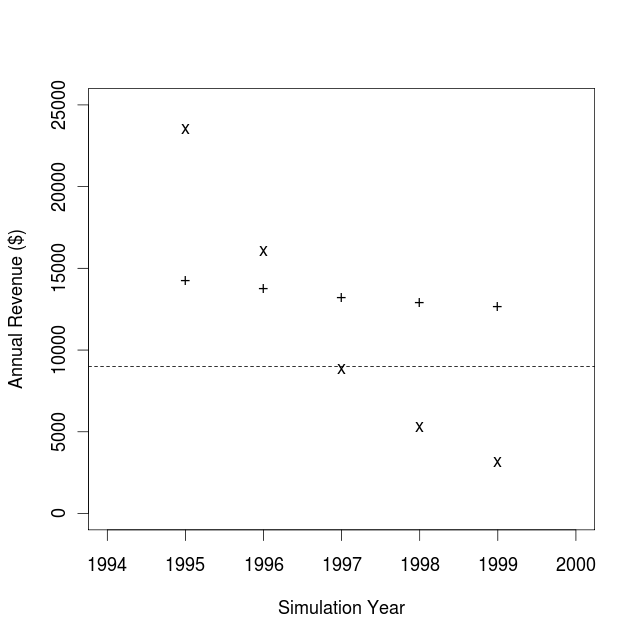
Figure 4: Revenue from each year of the experiment for tax rates of 9% (+) and 15% (x). The dashed line is the approximate expenses.
Discussion
- I'm pretty sure the game designers of Sim City 2000 did not program in the Laffer curve. Rather, I assume they made it so that the tax rate was one of the factors that induced the virtual population to immigrate to or emigrate from your city. The Laffer curve seen in Figure 3 then arises as an emergent phenomenon resulting from the interaction between the tax rate and the size of the tax base.
- Other Sim City cities will probably have different Laffer curves, depending on the other factors (such as low crime, good education and health services, etc.) that make the virtual population want to live there or not.
- Since I was working with a mature Sim City file, with no zoned-but-undeveloped land available, there were no growth benefits seen at low tax rates.
- Not everyone in the game leaves right away when taxes get too high for their liking, so setting a very high tax rate (20% is the highest the game allows) can provide a burst of revenue in the short term while the consequences of negative growth won't appear until later.
- 20% is a ridiculously-high property tax! Who would tolerate paying the full assessed value of their property to the city every five years? (Cities in Canada average around 2.7% ($26.85 per $1000 assessed value) for residential property taxes).
- In Sim City, maximizing revenue will usually be a good course of action (except when you are aiming for rapid growth). In real life, however, I hope the tax rate stays well below the Laffer curve maximum. Unlike in video games, there's more to society than the government; and individuals, families, businesses, and voluntary associations need money to do their things, too.
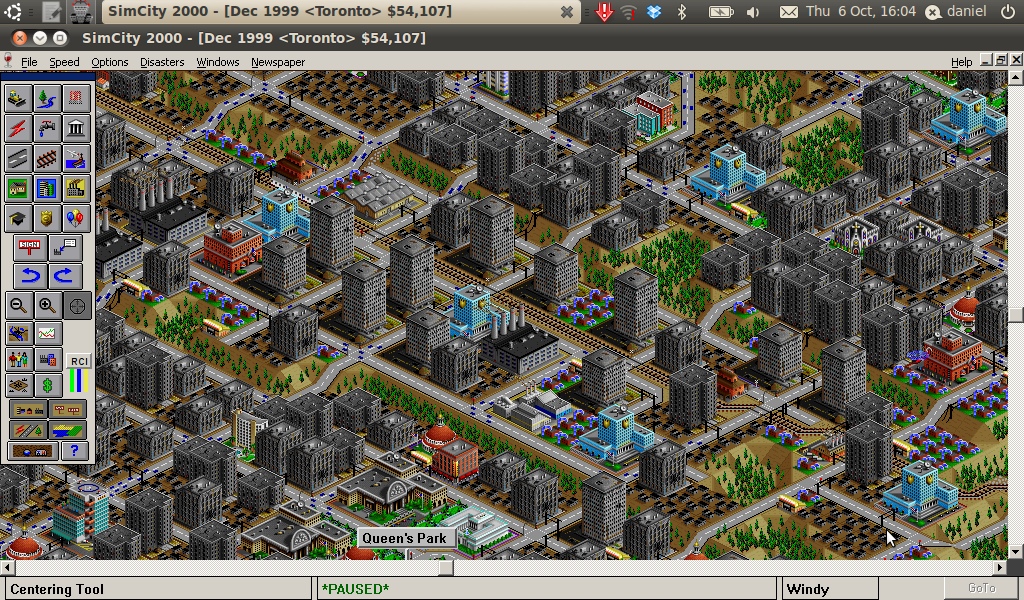
Figure 5: A severely over-taxed Sim City.
When I first posted this note on Facebook, it generated some good discussion:
- One thing to note is that imbalances in cash flow just affected cash reserves or debt. I didn't increase spending when I had a surplus or cut back when I had a deficit.
- 20% was the maximum tax rate in the game. I think the rise in revenue above 15% has a couple of causes. For one, at the really high tax rates the income is increased in the first year or two before everyone moves out so that holds the 5-yr avg up. Also, there may be some properties that don't bail or decline in assessed value no matter what (e.g. airports), but I'm not sure about that.
- In a more sophisticated game it would be interesting to consider the theories of Barro or Amery (1,2).