Calibrating a homemade probe
This post is a continuation of the previous one on making a homemade probe for dissolved solids in water. Here I explain how I calibrated it after I got it working.
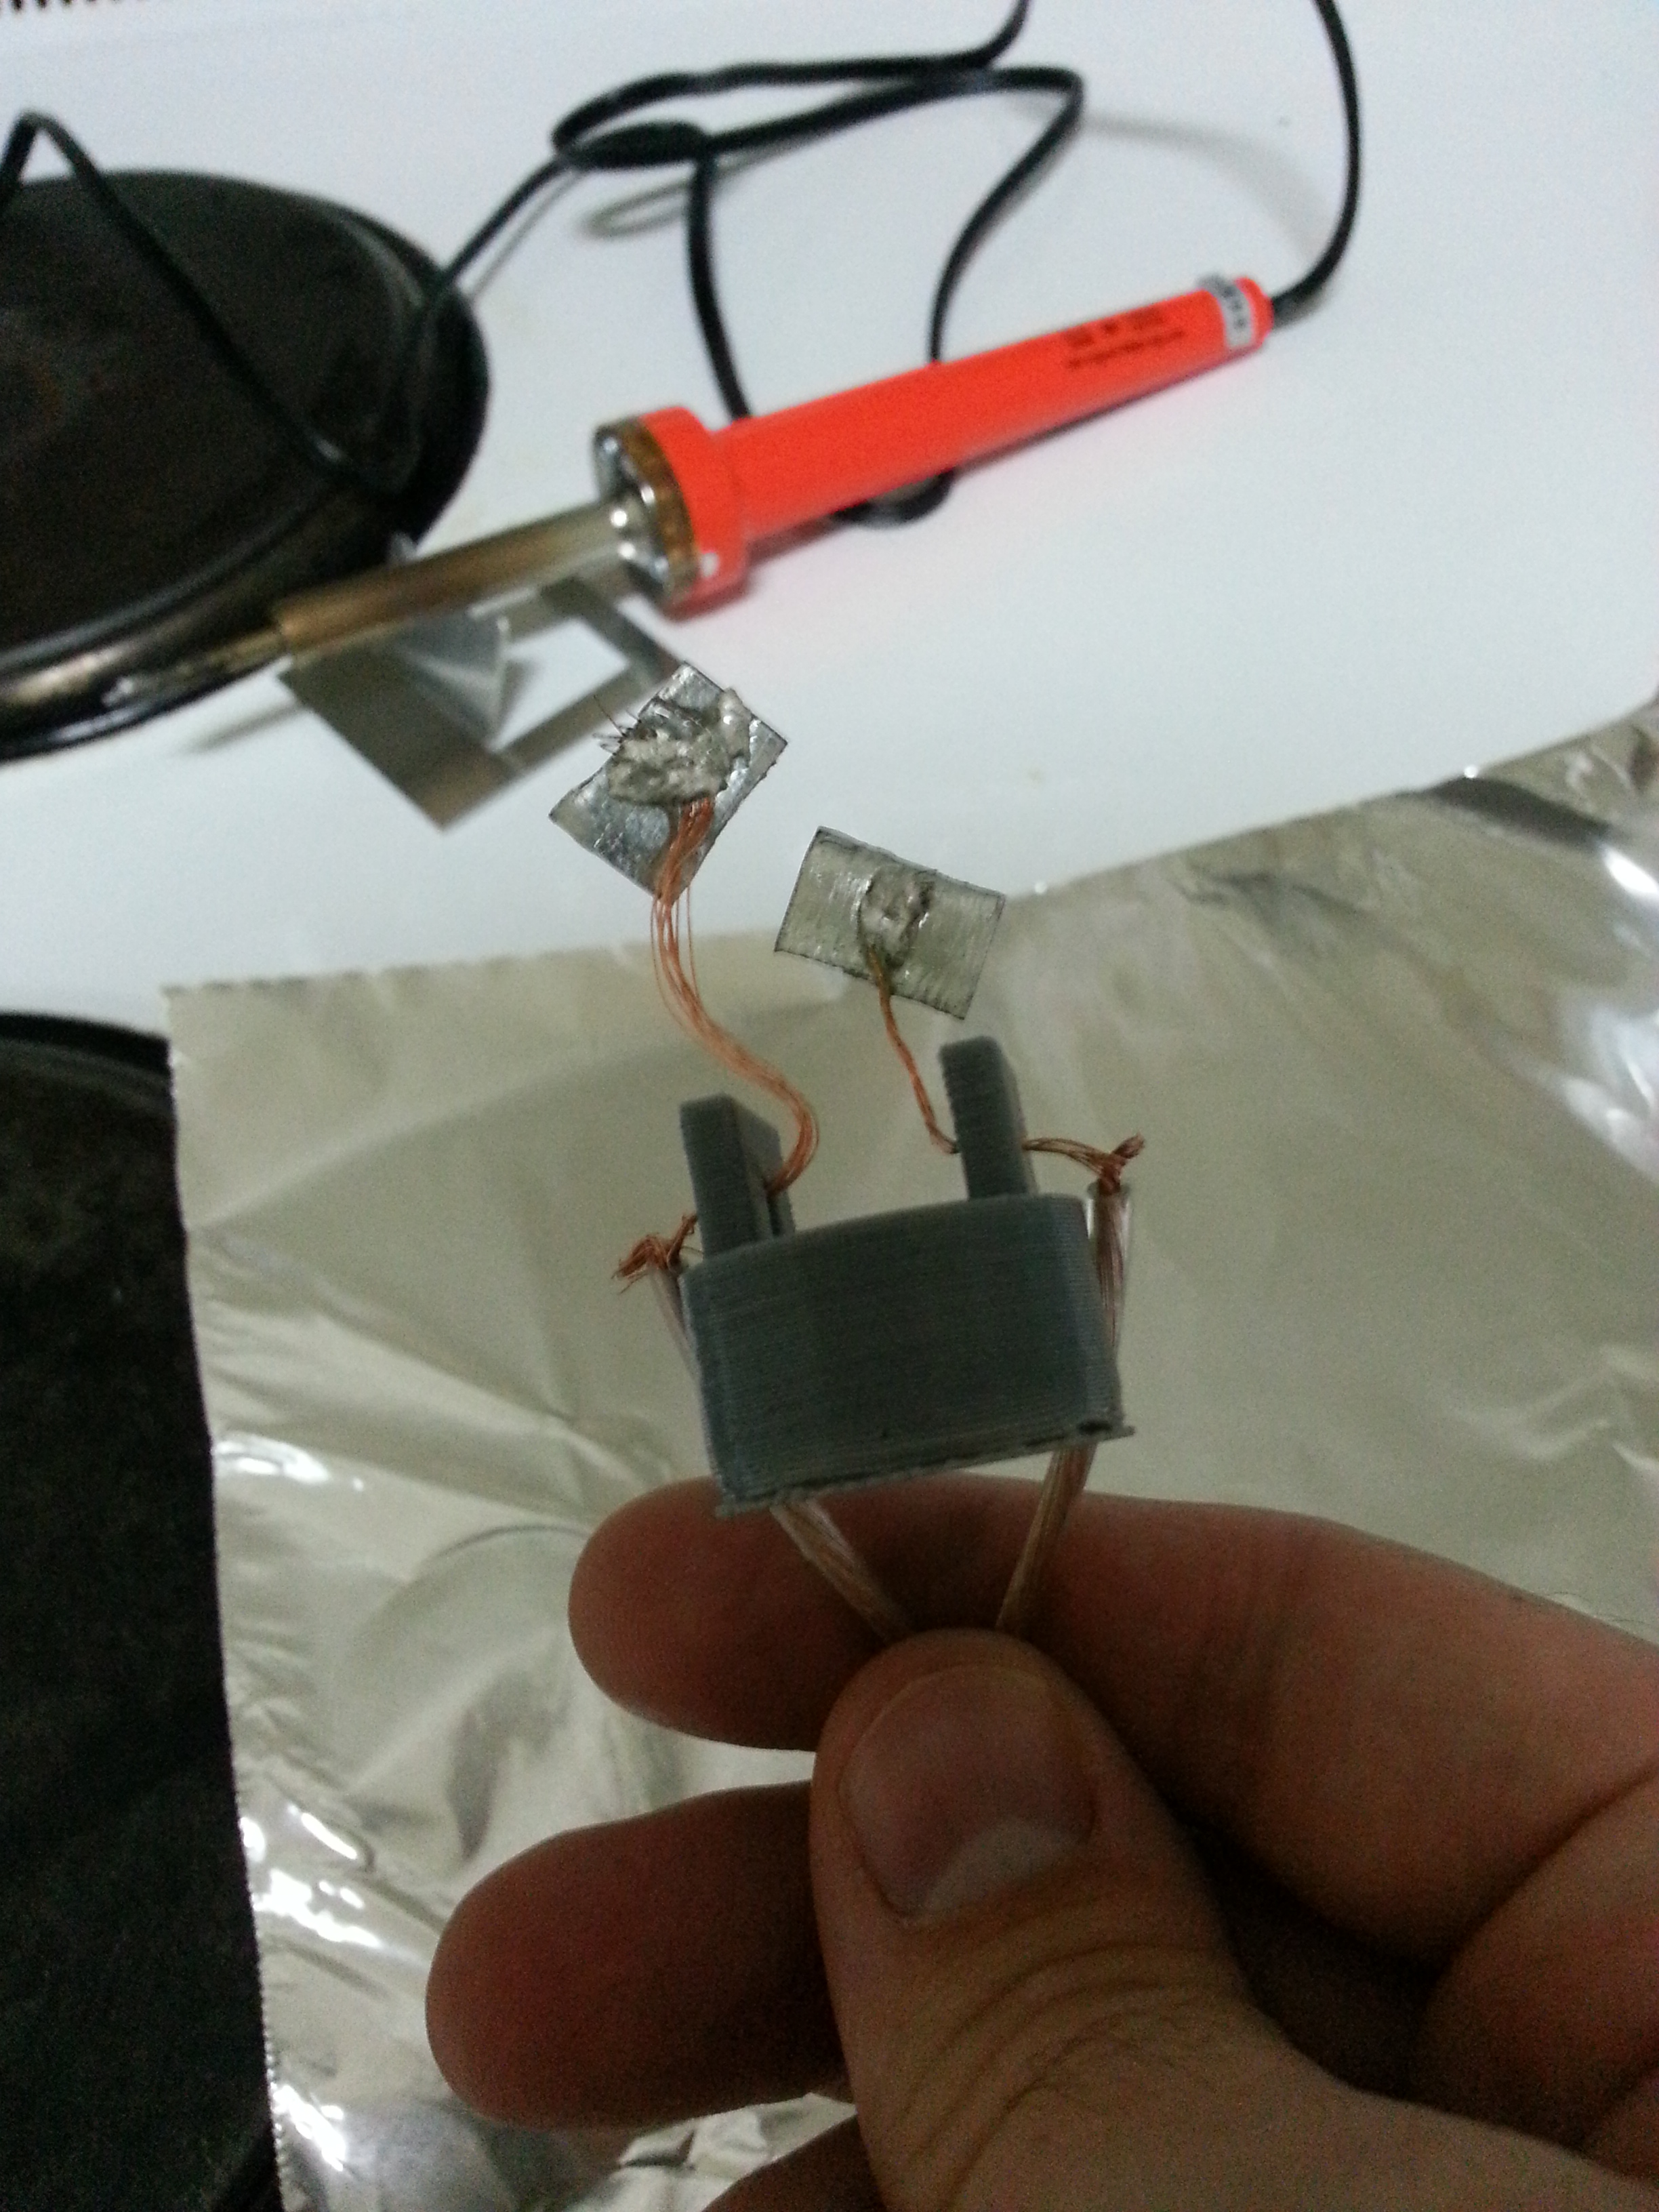
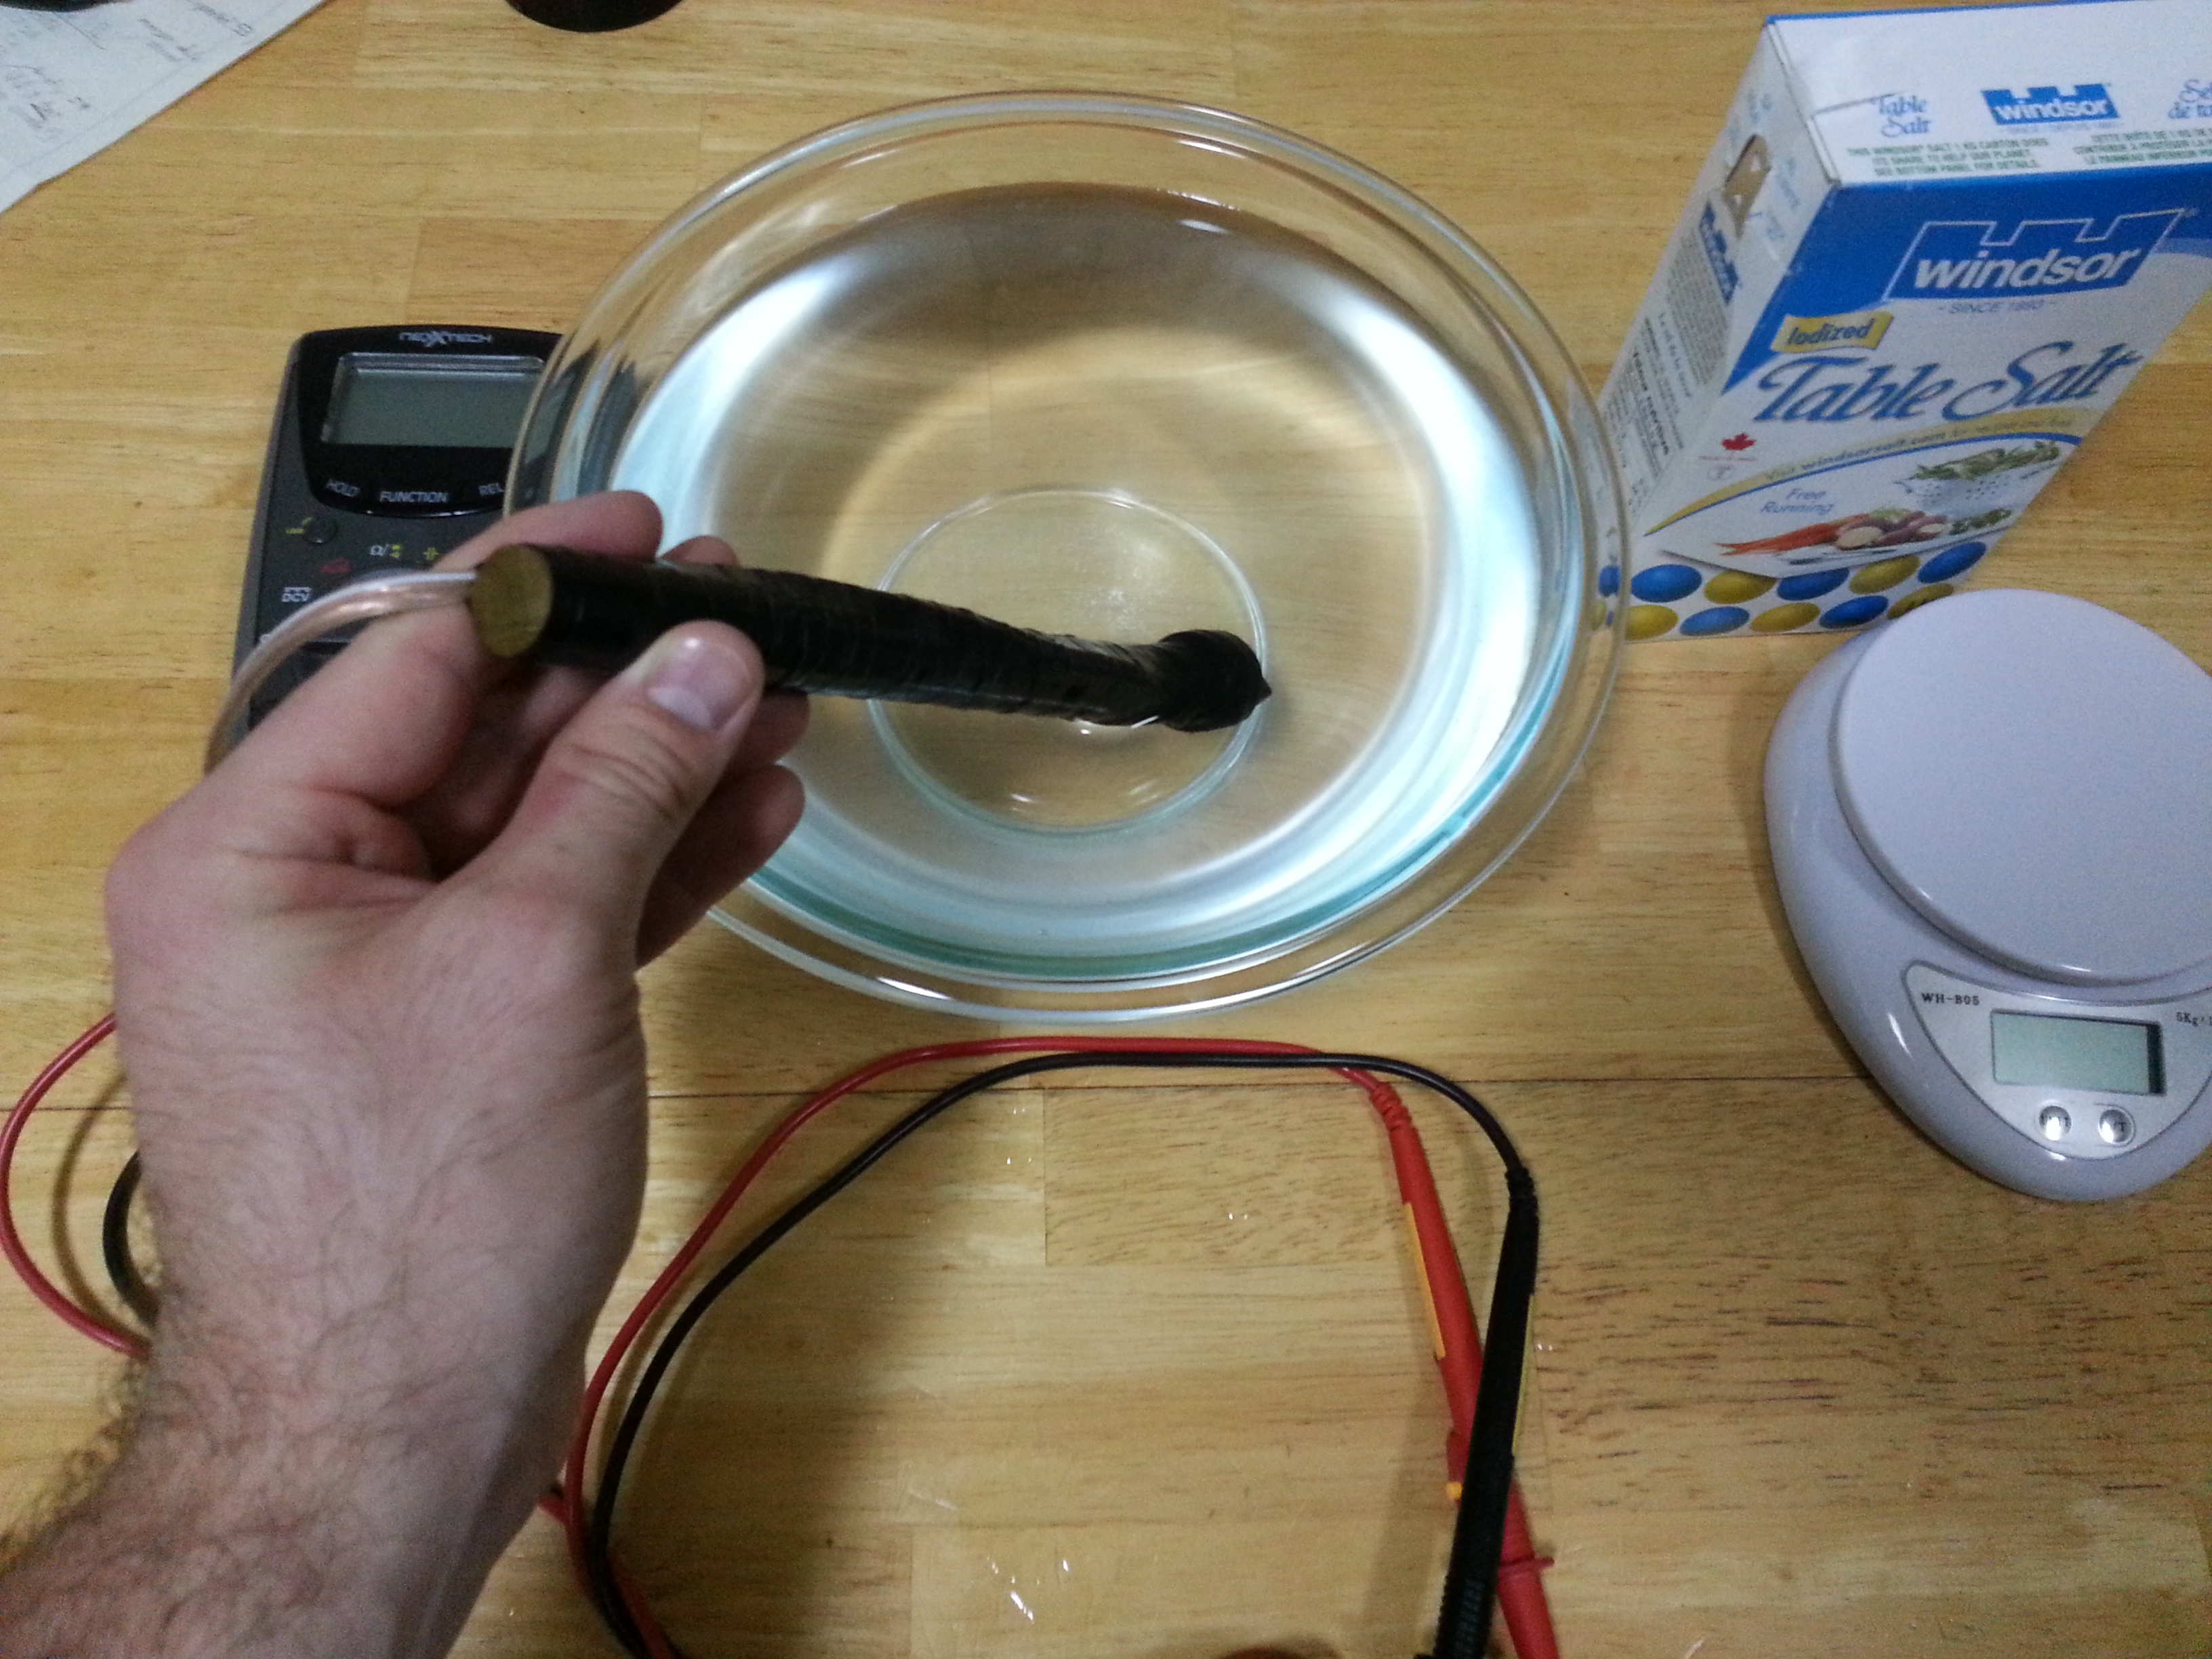
After printing off a new probe tip, I soldered some speaker wire to pieces of metal with an area of 1 cm2. To make sure I had solved the problem I faced previously, I tested the electrical connection before proceeding. Then I continued as before, gluing the electrode plates to the probe tip and the probe tip to a wooden dowel, and wrapping it all in electrical tape.

To calibrate the probe, I started with distilled water, which has a negligible amount of dissolved solids. Then I added known amounts of table salt and measured the resistance across the electrodes. With 1 g of salt in 2 L of distilled water (i.e. 0.5 g/L = 500 mg/L), the resistance was 23 kΩ, for example.
Before moving on, there are a few limitations on the accuracy that I should note:
- My equipment for measuring the quantities of salt and water was not laboratory quality; my kitchen scale, for example, only measures to the nearest gram and doesn't always budge from zero when only loaded with one or two grams—so measuring a gram or two at a time involves some guess-work.
- The electrode plates on the probe tip ended up closer than 1 cm apart and not perfectly parallel after being glued. This would have affected the electrical path between them in the salt solution.
- I think the electrical connection in the probe partially short-circuited for one measurement, because the resistance measured was a significant outlier: 250 ohms, while the other measurements were in the kilo-ohm range. Salt water was getting up under the electrical tape, which could have been the cause.
In spite of these issues, I was able to generate a decent calibration curve (after excluding the resistance measurement that was an outlier). For future iterations of this project, I would work on getting the electrode plates positioned more precisely, using better quality metal (probably stainless steel) for the plates, and trying to seal any bare metal besides the plate surfaces to avoid short-circuiting.

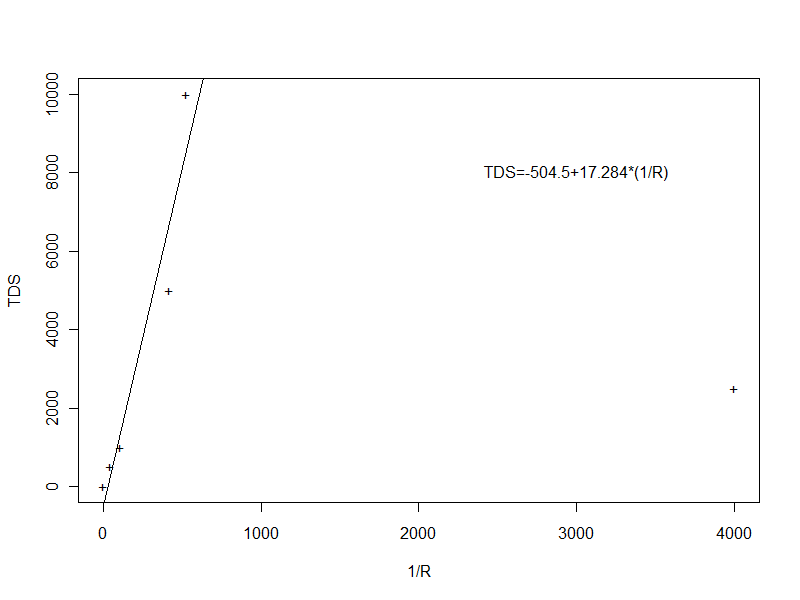
I calculated the calibration curve (a linear "curve") in R (see the graph and session log below). The statistical fit was much better when the outlier was excluded ("fit2" in the session log), so I used the results of that linear regression:

> Rohms <- c(330000,23000,9000,250,2400,1900)
> TDSmgL <- c(0,500,1000,2500,5000,10000)
> CmicroScm <- 1000000/Rohms
> summary(CmicroScm)
   Min. 1st Qu.  Median    Mean 3rd Qu.    Max.
   3.03   60.39  263.90  850.10  498.90 4000.00
> fit1 <- lm(TDSmgL ~ CmicroScm)
> fit2 <- lm(TDSmgL[Rohms>1000] ~ CmicroScm[Rohms>1000]) #excluding possible outlier
> summary(fit1)

Call:
lm(formula = TDSmgL ~ CmicroScm)

Residuals:
    1     2     3     4     5     6
-3074 -2578 -2086 -1011  1881  6869

Coefficients:
             Estimate Std. Error t value Pr(>|t|)
(Intercept) 3073.6279  2020.6750   1.521    0.203
CmicroScm      0.1094     1.2198   0.090    0.933

Residual standard error: 4248 on 4 degrees of freedom
Multiple R-squared: 0.002008,	Adjusted R-squared: -0.2475
F-statistic: 0.00805 on 1 and 4 DF,  p-value: 0.9328

> summary(fit2)

Call:
lm(formula = TDSmgL[Rohms > 1000] ~ CmicroScm[Rohms > 1000])

Residuals:
      1       2       3       4       5
  452.1   253.0  -415.9 -1697.1  1407.8

Coefficients:
                        Estimate Std. Error t value Pr(>|t|)
(Intercept)             -504.504    859.269  -0.587  0.59838
CmicroScm[Rohms > 1000]   17.284      2.818   6.133  0.00872 **
---
Signif. codes:  0 '***' 0.001 '**' 0.01 '*' 0.05 '.' 0.1 ' ' 1

Residual standard error: 1330 on 3 degrees of freedom
Multiple R-squared: 0.9261,	Adjusted R-squared: 0.9015
F-statistic: 37.62 on 1 and 3 DF,  p-value: 0.008716

> plot(CmicroScm,TDSmgL,pch="+",xlab="1/R",ylab="TDS")
> abline(fit2)
> text(3000,8000,"TDS=-504.5+17.284*(1/R)")
I also used my probe to measure tap water and water from the Nashwaak River:
- Tap water: 12.3 kΩ, which is 900 mg/L TDS from the calibration curve
- Nashwaak River: 11.5 kΩ, which is 1000 mg/L TDS from the calibration curve
These values seem a little high to me (on the upper threshold of freshwater); as mentioned above, my kitchen scale was imprecise for preparing low-concentration solutions of salt, so I surmise that my calibration erred on the high side.
Doing this project reminded me a bit of the Industrial Revolution, during which the development of tools and instruments for machining and measuring with greater precision was an important part of the cycle of sustained innovation. What we can learn about the world around us is limited on a pretty fundamental level by the precision of the tools we have available. Homemade scientific instruments and DIY calibration procedures aren't going to be competitive with professional ones, but can still be a step forward for satisfying personal curiosity.