Most Probable Number
I wrote an R script for calculating MPN.
The Most Probable Number (MPN) method is a long-standing way of calculating the concentration of bacteria in a sample (usually expressed as cells/100 mL). Its distinctive is that it doesn't require a quantitative lab assay; instead, it takes presence/absence results from a series of dilutions and uses statistical techniques to calculate what the most probable number (the name of the method is very literal) of cells was in the original sample given the results observed in the dilution series.
A typical way of applying this test is to serially dilute the original sample by factors of ten, filling a number (e.g. 5) of tubes from each dilution step. The tubes will have decreasing volumes of the original sample (e.g. 10, 1, and 0.1 mL per tube) along with dilution water and growth media. There will also be a way to detect which tubes have bacteria growing in them such as the production of gas bubbles or chemical byproducts. So each step in the dilution will have a number of tubes with bacteria detected (e.g. 0 – 5 positive results) and a number with no bacteria detected (e.g. 0 – 5 negative results). In order for the MPN method to work, the dilution series must reach a range where a mix of positive and negative results are observed.
Calculating the MPN directly is difficult to do by hand, since it requires evaluating the probability of the observed results under several possible values for the MPN until the maximum is found. Traditionally, therefore, results were looked up in pre-calculated tables.
The direct calculation assumes a poisson distribution:
P(k) = exp(-λ)(λ^k/k!), where:
- k = number of observed occurrences
- P(k) = probability of observing k occurrences
- λ = true mean
A negative tube has 0 cells and a positive tube has some unknown number greater than 0. The overall probability of a set of positive and negative results is found by multiplying their individual probabilities together.
- P(0) = exp(-λ) for negative
- P(>0) = 1 - P(0) for positive
The Metcalf & Eddy Wastewater Engineering textbook gives the following equation for the overall probability (with the notation slightly changed):
y = (1/a) Πi ([1-exp(-niλ)]^pi) ([exp(-niλ)]^qi), where:
- y = probability
- a = a constant
- i = dilution
- ni = volume of original sample in each dilution in the series
- pi = number of positive results in each dilution
- qi = number of negative results in each dilution
The value of λ that maximizes y (or y*a if the constant is dropped) is the MPN. It is replaced with niλ in the above equation to correct for the volume of original sample in each dilution step. The exponents indicate that the probability of a positive or negative tube must be included in the multiplication (for combined probability) the number of times it occurred.
With that background explanation, here is the script, MPNCalc.R:
### MPNCalc.R
#
# This R script calculates the most probable number (MPN)
# of microorganisms given presence/absence results from
# a dilution series.
#
# It is based on first principles: the probability of a sequence of positive results occurring given
# possible/presumed values to test for the true concentration of cells per mL (converted to cells/100mL
# for standardized reporting)
# (see Eqn 2-74 in the Metcalf and Eddy *Wastewater Engineering* textbook)
#


# GET RESULTS OF CULTURE TESTING
# Could change this to call for inputs from interactive interface...

Ndilutions <- 4 #number of dilutions in the series
Nper <- 5 #number of test tubes per dilution
VolPerDilution <- c(1,0.1,0.01,0.001) #volume of original sample in each dilution in the series
PositivePer <- c(4,3,2,0) #number of test tubes per dilution with bacteria present

#check that the length of VolPerDilution and PositivePer both equal Ndilutions; return an error otherwise
if (length(VolPerDilution) != Ndilutions || length(PositivePer) != Ndilutions) {
  stop("ERROR: inconsistent data entered: number of dilutions in series need to match")
}

TotalPer <- rep(Nper,Ndilutions)
NegativePer <- TotalPer - PositivePer
TotalVol <- TotalPer*VolPerDilution
NegativeVol <- NegativePer*VolPerDilution

# FUNCTION AND INITIAL VALUE

#Guess at MPN using Thomas Equation
ThomasMPN <- (sum(PositivePer[PositivePer<Nper&PositivePer>0]))/sqrt(sum(NegativeVol[PositivePer<Nper&PositivePer>0])*sum(TotalVol[PositivePer<Nper&PositivePer>0]))

#should start with first dilution with at least one negative and go to last dilution with at least one positive
#here I'm including ones that have at least one positive and one negative

#Define the function for calculating probability
Poisson <- function(N, v, p, q, lambda){
  if (lambda < 0) {
    stop("lambda cannot be negative")
  }
  ya <- numeric(N) #ya is proportional to the probability; need to maximize it
  for (i in 1:N) {
    ya[i] <- ((1 - exp(-1*v[i]*lambda))^p[i])*((exp(-1*v[i]*lambda))^q[i])
  }
  prod(ya)
}

#call as Poisson(Ndilutions, VolPerDilution, PositivePer, NegativePer, lambda)
##lambda is a possible value for the MPN; need to find lambda that maximizes Poisson function

# FIND THE MAXIMUM
##This assumes that there is a single maximum, so a local max is the global max.


#start from ThomasMPN; differential is based on accuracy to three signficant figures
TestLambda <- ThomasMPN
Differential <- TestLambda*0.01

RightDiff <- Poisson(Ndilutions, VolPerDilution, PositivePer, NegativePer, (TestLambda + Differential)) - Poisson(Ndilutions, VolPerDilution, PositivePer, NegativePer, TestLambda)
LeftDiff <- Poisson(Ndilutions, VolPerDilution, PositivePer, NegativePer, (TestLambda - Differential)) - Poisson(Ndilutions, VolPerDilution, PositivePer, NegativePer, TestLambda)

#iterate until a max is reached
while (RightDiff > 0 || LeftDiff > 0) {
  if (RightDiff > 0) {
    Extrap <- (RightDiff / abs(abs(RightDiff) - abs(LeftDiff))) #Treat this like a parabola and assume a constant 2nd order difference between equally spaced points
    TestLambda <- TestLambda + (Extrap*Differential)
  }
  if (LeftDiff > 0) {
    Extrap <- (LeftDiff / abs(abs(RightDiff) - abs(LeftDiff)))
    TestLambda <- TestLambda - (Extrap*Differential)
  }
  RightDiff <- Poisson(Ndilutions, VolPerDilution, PositivePer, NegativePer, (TestLambda + Differential)) - Poisson(Ndilutions, VolPerDilution, PositivePer, NegativePer, TestLambda)
  LeftDiff <- Poisson(Ndilutions, VolPerDilution, PositivePer, NegativePer, (TestLambda - Differential)) - Poisson(Ndilutions, VolPerDilution, PositivePer, NegativePer, TestLambda)
}

# KEEP CALCULATION OUTCOME

MPN <- TestLambda
MPN100 <- MPN*100 #Convert result from cells/mL to cells/100 mL for standardization
Results
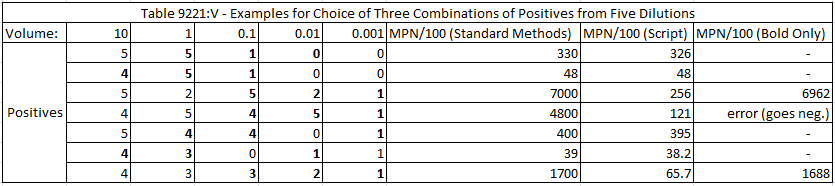
I compared the results from my script with a table in Standard Methods. The table selects results from three dilutions (out of five) whereas I used all five in my script. In many cases the MPN calculated from my script was close enough to round to the same value as in Standard Methods. However, for some of the examples, the results were vastly different when all five dilutions were used—but became close again if only the three dilutions bolded in the table below were used. Basically, if negative results at a higher dilution were included, a lower number of cells would be implied to be most probable. This illustrates the risk of discarding data points.
The table also shows an error for one calculation. I set up the script so that if the numerical solver goes to a negative value for MPN then it quits.
There are a few things that could improve the script I wrote. It would be more user-friendly if it took input from an interactive session instead of needing to change the following lines every time:
Ndilutions <- 4 #number of dilutions in the series
Nper <- 5 #number of test tubes per dilution
VolPerDilution <- c(1,0.1,0.01,0.001) #volume of original sample in each dilution in the series
PositivePer <- c(4,3,2,0) #number of test tubes per dilution with bacteria present
Also, it might work more quickly if it used R's built-in Poisson distribution function—it is a statistics language, after all. Finally, a different numerical method for finding the value of λ that gives the maximum probability might be faster and/or more robust. Initially, I tried to implement a Golden Section Search but couldn't get it quite right.
Because the MPN method relies on statistics instead of sophisticated quantitative microbiological assays, it might even be possible to do at home. I'd need to collect a sample (e.g. of river water), make some culture media, perform some dilutions, and then estimate the level of bacteria based on the number of positive and negative tubes. If I do this sometime, I'll likely write about it here.