NB Budget 2018 - Getting Educated
As in previous years, I've written the post below to provide a summary of New Brunswick's latest provincial budget, which was released today. I've also chosen to take a closer look at the Department of Education and Early Childhood Development this time.
Where Things Stand
To start with, here are some of the key estimates in the provincial budget for the fiscal year ahead (2018 – 2019). To facilitate comparisons, I'm stating everything in millions of Canadian dollars:
- Projected total revenues of $9427M
- Projected total expenditures of $9615M
- A projected deficit of $189M, up from $115M last year
- The 2017 deficit was projected at $192M but came in at $115M—so this year's projected deficit is basically unchanged from what was planned last year
- Projected net debt of $14470M this time next year
The departments with the largest budgets are as follows:
- Health: $2753M
- Education and Early Childhood Development: $1258M
- Social Development: $1195M
- General Government: $792M
- Debt Service: $675M
- Post-secondary Ed., Training, and Labour: $645M
- Transportation and Infrastructure: $307M
- Justice and Public Safety: $232M
These budgets are for their ordinary accounts (which doesn't include capital spending, amortization, etc.). The department of Transportation and Infrastructure (which looks after most capital projects for the Provincial government) has a capital budget of $688M for 2018.
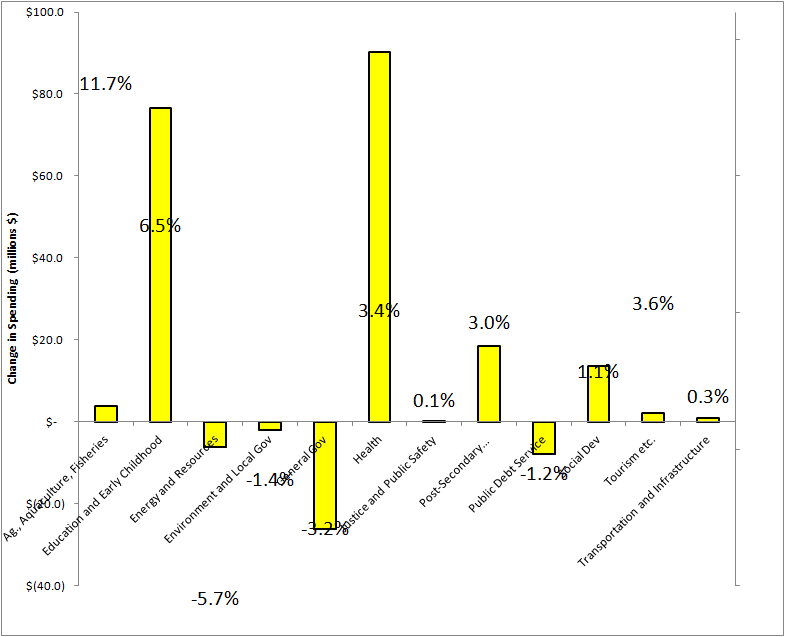
The following graph (using data from p.14 in the Budget document) shows the change in spending from 2017 to 2018 for a number of departments. In contrast to last year, I've graphed the magnitude of the change instead of the percentage (but the percentages are marked on the graph) since I found that the percentages put too much focus on relatively small changes to small departments. For example, the 3.4% increase in the Department of Health's budget is a bigger deal than the 11.7% increase in the budget for Agriculture, Aquaculture, and Fisheries. Also note that these changes are from the actual expenditures last year to the budgeted expenditures this year; General Government (which includes pensions and Service NB) has approximately the same budget this year as last year but it is showing up as a 3.2% decrease because their spending was higher in 2017 than estimated in the budget for that year.

Major anticipated sources of revenue for the Government of New Brunswick in 2018 include:
- Taxes: $4537M
- Equalization payments: $1874M
- Other grants from the Federal Government: $1351M
- Other self-generated revenue (Licenses, Royalties, Lottery, Etc.): $1200M
Projected tax revenue is decreasing from $4571M in 2017. I'm not aware of significant changes to tax rates, so I assume this is due mainly to anticipated changes in the size of the tax base. Equalization payments are projected to increase from $1760M in 2017.
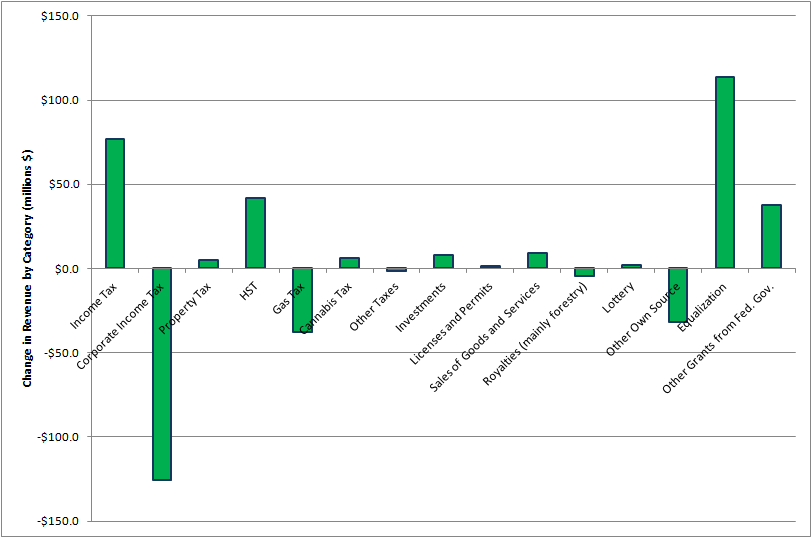
The following graph (using data from p.171 in the Budget document) shows the change in revenue, by source, from 2017 to 2018. As in the previous graph, it compares the estimated revenue for the fiscal year ahead to the actual revenue of the preceding fiscal year. Likewise, it focuses on the magnitude of the change.

There are two newsworthy things to note about NB taxes in 2018:
- The decrease in gas tax shown is due to the creation of a Climate Change Fund which has been carved out of the gas tax—I discuss this further in a subsequent section
- The provincial government is anticipating $6M in tax revenue from marijuana once it is legalized; for comparison, tobacco taxes currently bring in around $150M per year
Updates
In my post last year I said:
A significant point in my view is that the total expenditures [in the 2015 budget] were $8630M, which is less than current revenue. If the government had been able to hold spending increases lower, then the budget could have been balanced by now without true cuts.
This still holds true, as projected revenue for 2018 is $9427M. Here is a statistic that really puts these trends into perspective:
Since 2007, provincial revenues have grown at an annual average rate of 2.5 per cent while spending has been growing at 3.1 per cent.
0.6 percentage points (i.e. the difference between the growth rates of spending and revenue) doesn't seem like much, but it more than adds up
Last year's budget post looked at the Department of Environment and Local Government. A recent news story seemed like a good follow-up to share on that topic: the city of Saint John wants to discuss amalgamation with some of its suburbs.
Carbon Tax
As mentioned above, the Provincial government is carving out a portion of the existing Gas Tax to be re-designated as a Climate Change Fund. This is to meet the mandate from Canada's Federal government that each province put a price on greenhouse gas emissions of $10/tonneCO2e, rising to $50/tonneCO2e by 2022 (so the Climate Change Fund will have to increase for the next five years). However, whether this plan will actually fulfill the criteria of the federal mandate is a bit unclear.
When the federal carbon tax plan was announced, I shared the following back-of-the-envelope calculations on Facebook to illustrate its potential impact:
But what does $50/tonne CO2e actually mean? Most context in news articles is in terms of the price of gasoline since that is the most visible source to the average person. However, energy is used in everything, so I think the focus needs to widen away from just the transportation sector. Here is a brief case study on how a craft brewery might be impacted (a lot of people have probably toured a brewery at some point, so I think this is a relatable example).
A typical craft brewery uses around 20 kWh of electricity and 150,000 Btu (0.16 GJ) of thermal energy per barrel brewed (a barrel is around 120 litres). In Canada, the electrical grid has an emissions factor of 0.18 kg CO2 per kWh. This is quite low compared to many other countries since the vast majority of our electricity comes from hydroelectric and nuclear generation; a kilowatt-hour in China is associated with 5x higher CO2 emissions since coal is such a major source of electrical generation there. For thermal energy, assuming the source is natural gas, emissions would be around 56 kg CO2 per GJ.
Using these numbers, brewing a barrel of beer would have associated CO2 emissions of: (20 kWh x 0.18 kg/kWh) + (0.16 GJ x 56 kg/GJ) = 3.6 kg + 9.0 kg = 12.6 kg. At $50/tonne, this is $0.63 per barrel. A craft brewery producing 50,000 – 100,000 barrels per year (this would be at the upper end of Canadian craft breweries) would thus be facing around $30,000 – $60,000 per year in added operating costs five years from now.
Department of Education
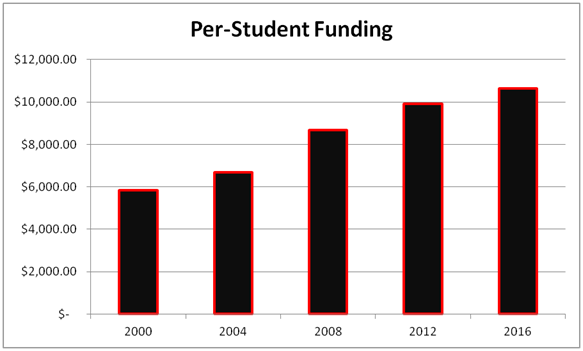
To look at the department of Education, I calculated per-student funding going back to 2000. I found enrollment numbers in reports on the Department of Education website (e.g. this one for the 2016 – 2017 school year) and the departmental budget from previous budget documents (available here). From 2012 forward, Early Childhood Development was part of the same department, so I subtracted its allocation from the departmental total. Here is a graph I made of Education funding divided by student enrollment (K – 12) by year:

The budget increased 43% from 2000 to 2016 (compared to 33% inflation over this timeframe) while enrollment dipped by 22% (125,000 students in 2000 to 98,000 in 2016; the number of schools also decreased from 336 in 2004 to 302 in 2016). The decrease in the number of students is probably due to generational demographics along with the shrinking population of the province as a whole. The combined effect of these two trends has been a steady increase in the spending per student.
The latest budget continues this trend. The Education budget (after subtracting $118M for Early Childhood Development) is $1140M for 2018. Dividing by 98,000 students (using 2016 enrollment since I don't have the most recent number available) gives $11,632 (not million) per student.
Unfortunately, even as spending has increased, educational outcomes aren't doing so well. For example, recently-released assessment results revealed that less than 40% of anglophone Grade 6 students have an appropriate level of math skills.
New Brunswick is not alone in this: many other provinces and states have similar trends of spending more—above the rate of inflation—on education (and also health care, housing, etc.) while seeing stagnant results. This is an interesting discussion on the phenomenon.
References
- Here is the main budget document
- Here is a news article about the budget
Finally, I'll note that the province of Newfoundland and Labrador has a debt of $15500M (and a population of 528,000 vs 754,000 in NB) so what happens there with respect to that debt could serve as a sort of preview for New Brunswick.