Ice-Out Dates in Oromocto Lake
I just got back from vacation, which is why I haven't had a post for a while. I plan to write some posts about my trip, but first I wanted to share this, since it is well-suited for this time of year.
In a paper titled "Influence of ocean-atmospheric oscillations on lake ice phenology in eastern North America" Doctors Patterson and Swindles investigated ice out dates for a number of lakes in New Brunswick, Maine, and New Hampshire.
Phenology is the "study of changes in the date of recurring natural phenomena".
In their introduction, they explain,
The annual dates in the spring when winter ice cover leaves a lake has come to be known as “ice out” (Hodgkins 2013).
Ice out is also sometimes referred to as “ice off” (e.g. Ghanbari et al. 2009) or “ice break up” (e.g. Sharma and Magnuson 2014). Ice out records are more valuable than
ice formation records as the breakup and disappearance of ice from a lake in the spring can occur very quickly (< 24 h), whereas fall freeze-up may take many days, and may be punctuated by several freeze–thaw cycles before ice finally settles in for the winter (Robertson et al. 1992).
Ice out dates for lakes correlate most strongly with local, late winter air temperatures and thus provide an important quantitative and annually-resolved source of hydrologic data for late-winter/early-spring climate change (Futter 2003; Hodgkins 2010; Hodgkins et al. 2002; Livingstone and Adrian 2009; Shuter et al. 2013). These data have been compiled primarily by amateur citizen scientists for a variety of purposes, including determining fishing seasons, estimating the spring opening of ferry boat routes, community contests, and general curiosity (Futter 2003; Hodgkins et al. 2002). Many ice out records extend well back into the nineteenth century, and are spread throughout the northern hemisphere (e.g. Magnuson et al. 2005). As such these records provide an important proxy for late-winter/early-spring climate in eastern North America, which extends beyond data available
from instrumental climate stations.
They cite previous research stating that the ice cover season has been shortening by 0.6 days per decade. In the current research, they looked at correlations between ice out dates and March–April temperature records, as well as between lakes. They found that,
All lakes in this dataset have trended toward earlier ice out dates, although there have been decadal-scale reversals
in the tendency to later ice out dates. ... After accounting for the considerable variation in absolute ice out dates between lakes, primarily related to climate variation associated with distance from the coast and elevation, there
is a strong coherence in the pattern of ice out across all lakes.
They also used spectral analysis to look at periodicity in ice out dates. They tried to relate the periodicity to known cycles such as the North Atlantic Oscillation (NAO) and Atlantic Multidecadal Oscillation (AMO).
I liked some of the figures the authors used to present their results. I also appreciated this note in the Acknowledgments: "We also thank the generations of citizen scientists who collected the ice out data for all the lakes used in this study."
I've done similar analyses before, so I thought I'd take one of the lakes they looked at (nearby Oromocto Lake) and do some statistical calculation of my own:
> IceOut <- read.csv("IceOutData.csv")
> summary(IceOut)
Year Mean Oromocto
Min. :1876 Min. : 91.1 Min. : 89.0
1st Qu.:1910 1st Qu.:110.9 1st Qu.:112.0
Median :1944 Median :116.8 Median :118.0
Mean :1944 Mean :115.4 Mean :117.3
3rd Qu.:1979 3rd Qu.:120.5 3rd Qu.:123.0
Max. :2013 Max. :132.8 Max. :144.0
NA's :1
> cor(IceOut$Mean,IceOut$Oromocto, use="complete.obs", method="spearman")
[1] 0.6133219
> cor.test(IceOut$Mean,IceOut$Oromocto, use="complete.obs", method="spearman")
Spearman's rank correlation rho
data: IceOut$Mean and IceOut$Oromocto
S = 165710, p-value = 1.623e-15
alternative hypothesis: true rho is not equal to 0
sample estimates:
rho
0.6133219
Warning message:
In cor.test.default(IceOut$Mean, IceOut$Oromocto, use = "complete.obs", :
Cannot compute exact p-value with ties
> cor(IceOut$Year,IceOut$Oromocto, use="complete.obs", method="spearman")
[1] -0.1702769
> cor.test(IceOut$Year,IceOut$Oromocto, use="complete.obs", method="spearman")
Spearman's rank correlation rho
data: IceOut$Year and IceOut$Oromocto
S = 501510, p-value = 0.04666
alternative hypothesis: true rho is not equal to 0
sample estimates:
rho
-0.1702769
Warning message:
In cor.test.default(IceOut$Year, IceOut$Oromocto, use = "complete.obs", :
Cannot compute exact p-value with ties
> wilcox.test(IceOut$Oromocto[IceOut$Year<=1944],IceOut$Oromocto[IceOut$Year>1944])
Wilcoxon rank sum test with continuity correction
data: IceOut$Oromocto[IceOut$Year <= 1944] and IceOut$Oromocto[IceOut$Year > 1944]
W = 2779, p-value = 0.06237
alternative hypothesis: true location shift is not equal to 0
> summary(IceOut$Oromocto[IceOut$Year<=1944])
Min. 1st Qu. Median Mean 3rd Qu. Max. NA's
89.0 114.0 119.0 118.8 126.0 144.0 1
> summary(IceOut$Oromocto[IceOut$Year>1944])
Min. 1st Qu. Median Mean 3rd Qu. Max.
90.0 110.0 117.0 115.7 122.0 135.0
> wilcox.test(IceOut$Oromocto[IceOut$Year<=1944],IceOut$Oromocto[IceOut$Year>1944],alternative="greater")
Wilcoxon rank sum test with continuity correction
data: IceOut$Oromocto[IceOut$Year <= 1944] and IceOut$Oromocto[IceOut$Year > 1944]
W = 2779, p-value = 0.03119
alternative hypothesis: true location shift is greater than 0
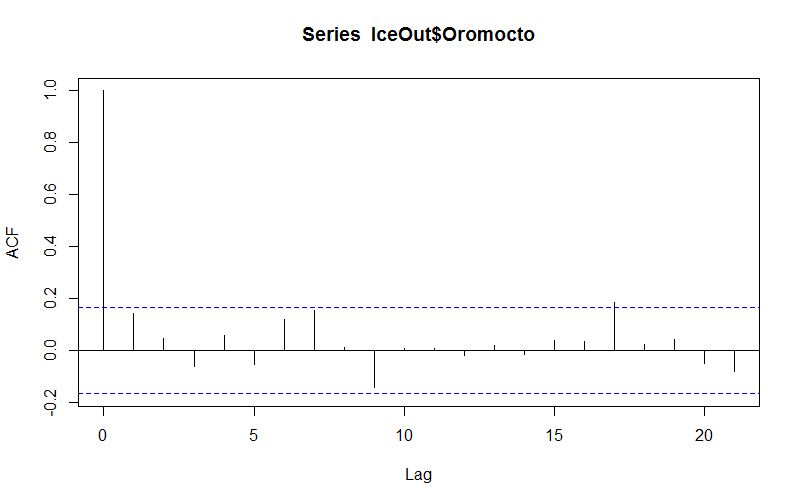
> acf(IceOut$Oromocto,type="correlation",plot=TRUE,na.action=na.pass)
> acf(IceOut$Oromocto,type="correlation",plot=FALSE,na.action=na.pass)
Autocorrelations of series ‘IceOut$Oromocto’, by lag
0 1 2 3 4 5 6 7 8 9 10 11
1.000 0.143 0.046 -0.061 0.057 -0.053 0.120 0.156 0.011 -0.143 0.010 0.009
12 13 14 15 16 17 18 19 20 21
-0.018 0.018 -0.014 0.041 0.035 0.184 0.025 0.042 -0.051 -0.081
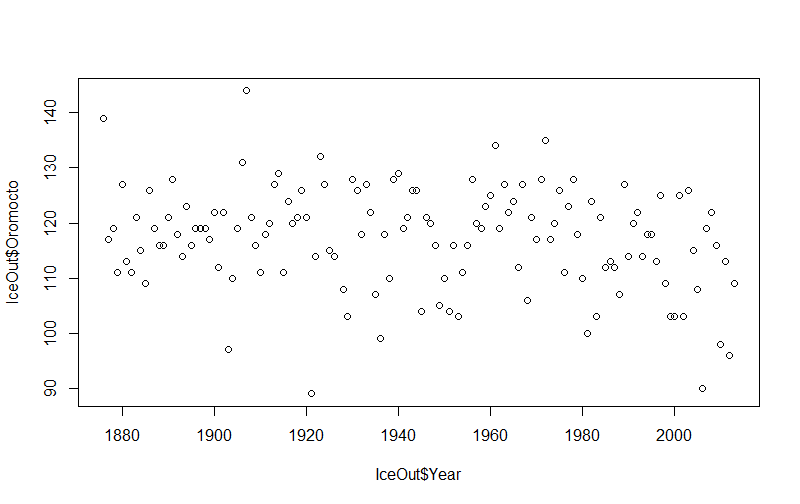
> plot(IceOut$Year,IceOut$Oromocto)
Here are my comments and observations:
- 1944 is middle year in the data set, so I used it to divide the data into earlier and later portions.
- Ice out dates are correlated between Oromocto and the mean of all lakes in the data set, suggesting regional climate has more of an influence on general cycles and trends than local-specific conditions. Similar results are mentioned in the paper.
- Spearman correlation (negative) with the year is significant (at 95% confidence) so there is a slight decreasing trend.
- Mann-Whitney U test only found a significant (at 95% confidence) difference in ice-out dates between the first and last half of the data set when a one-sided condition was specified (i.e. incorporating the assumption that ice out dates were later on average before 1944).
- Only 2 – 3 day difference in the average ice-out date before and after 1944; the earliest ice-out date is almost the same (around March 31st) (I don't know what it was this year).
- Strongest auto-correlation results were at 7 and 17 years, with an inverse correlation at 9 years spacing. This compares to spectral peaks shown in the paper (Fig. 5) at 6.1, 7.8, and 16.7 years.