The Rains of Quinault
One of the highlights of my trip to the West Coast was spending a long weekend in Olympic National Park with a couple of friends. This enormous park (bigger than the state of Rhode Island, apparently) has everything from mountains, to temperate rainforests, to coastline.
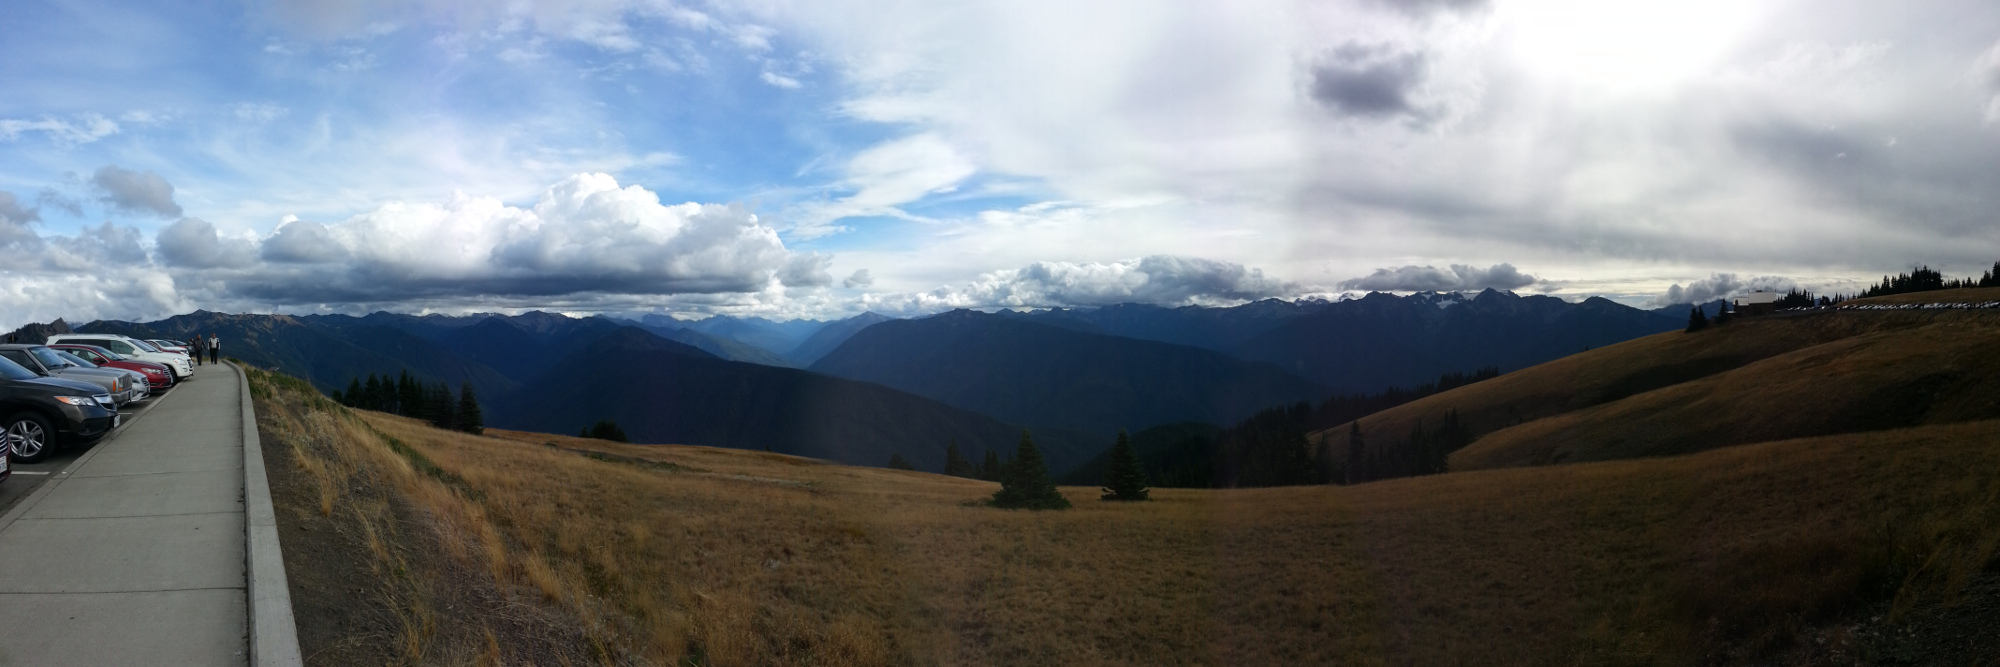
On the first day, we drove up Hurricane Ridge to enjoy the views.
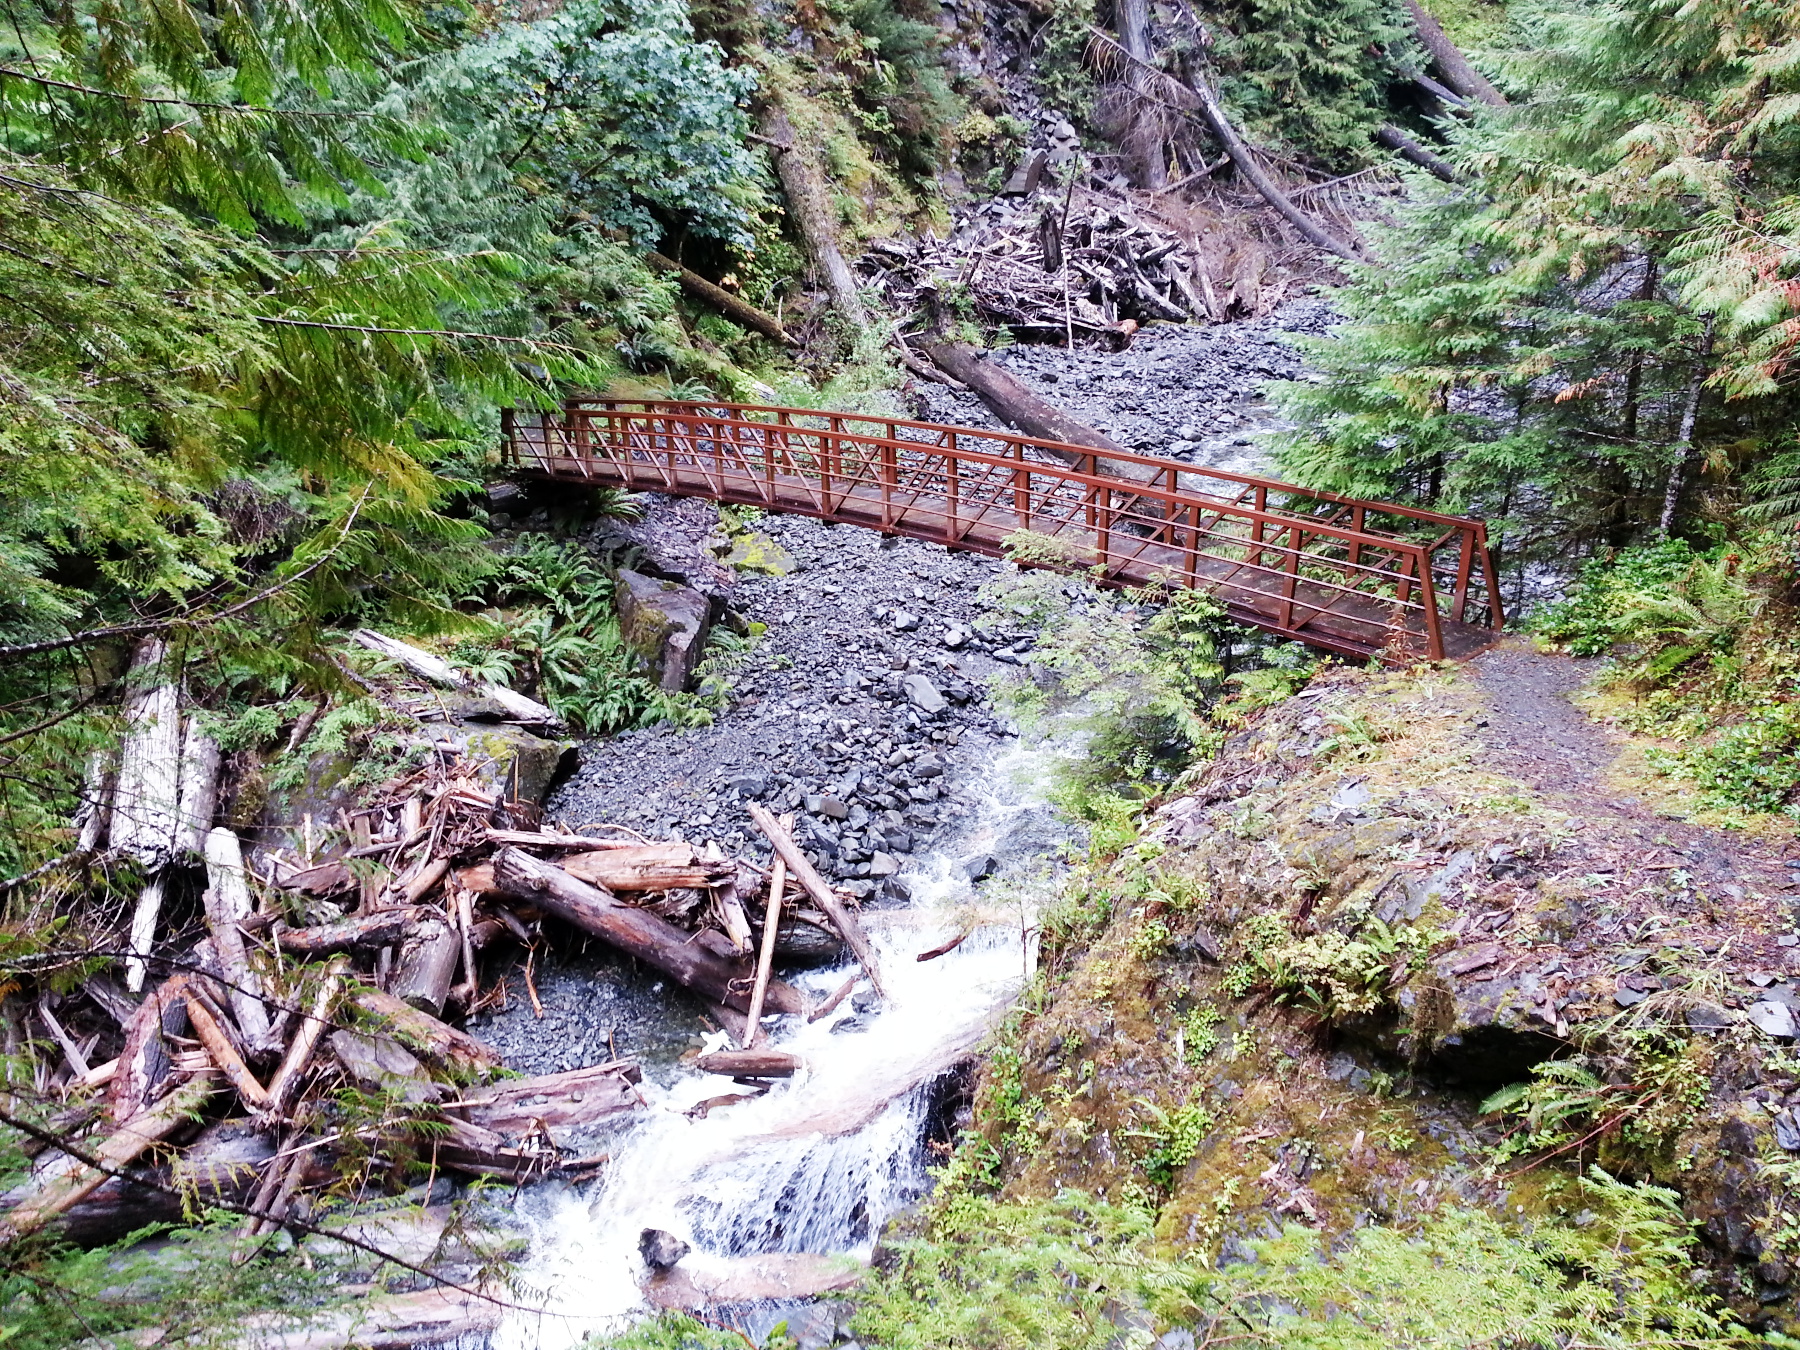
After a lot more driving, we got to our cabin in Quinault, Washington. The next day, we hiked a trail off the north fork of the Quinault River to reach the largest yellow cedar in the world. This area is classified as a temperate rainforest and is full of massive trees—primarily cedars, douglas firs, and sitka spruce; it also has lots of frogs, moss, and ferns. The hike was around 11 – 12 miles, but the trail goes much further for people who want to do multi-day backpacking.
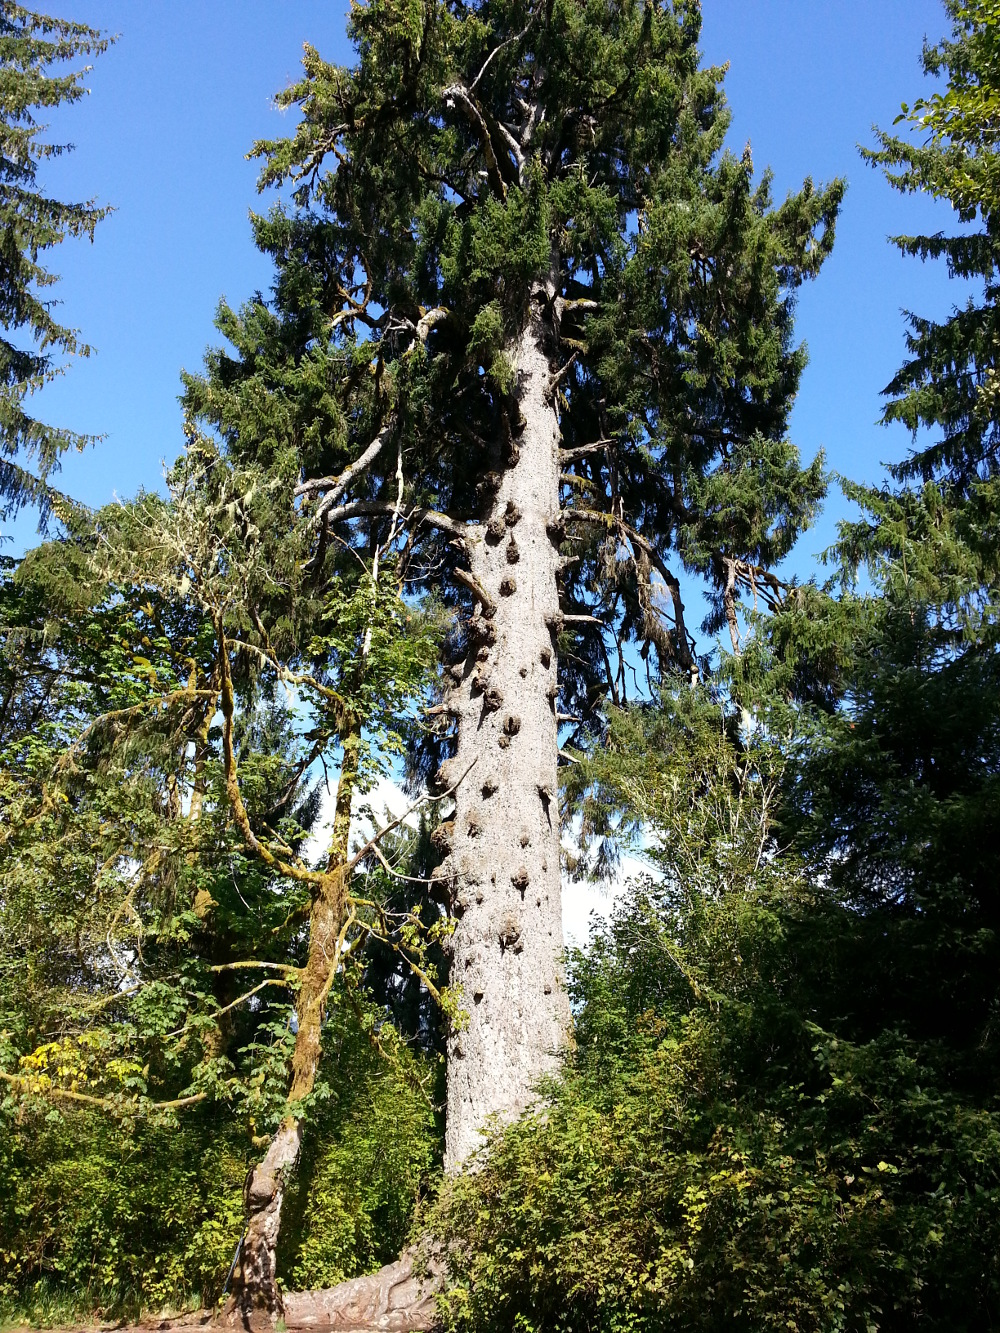
An even bigger tree, the world's largest Sitka Spruce at almost 59 feet in circumference and around 190 feet tall, was right on the same grounds as our cabin:
In a historic lodge in Quinault, I found this record of 8 decades of rainfall—it's called a rainforest for good reason!
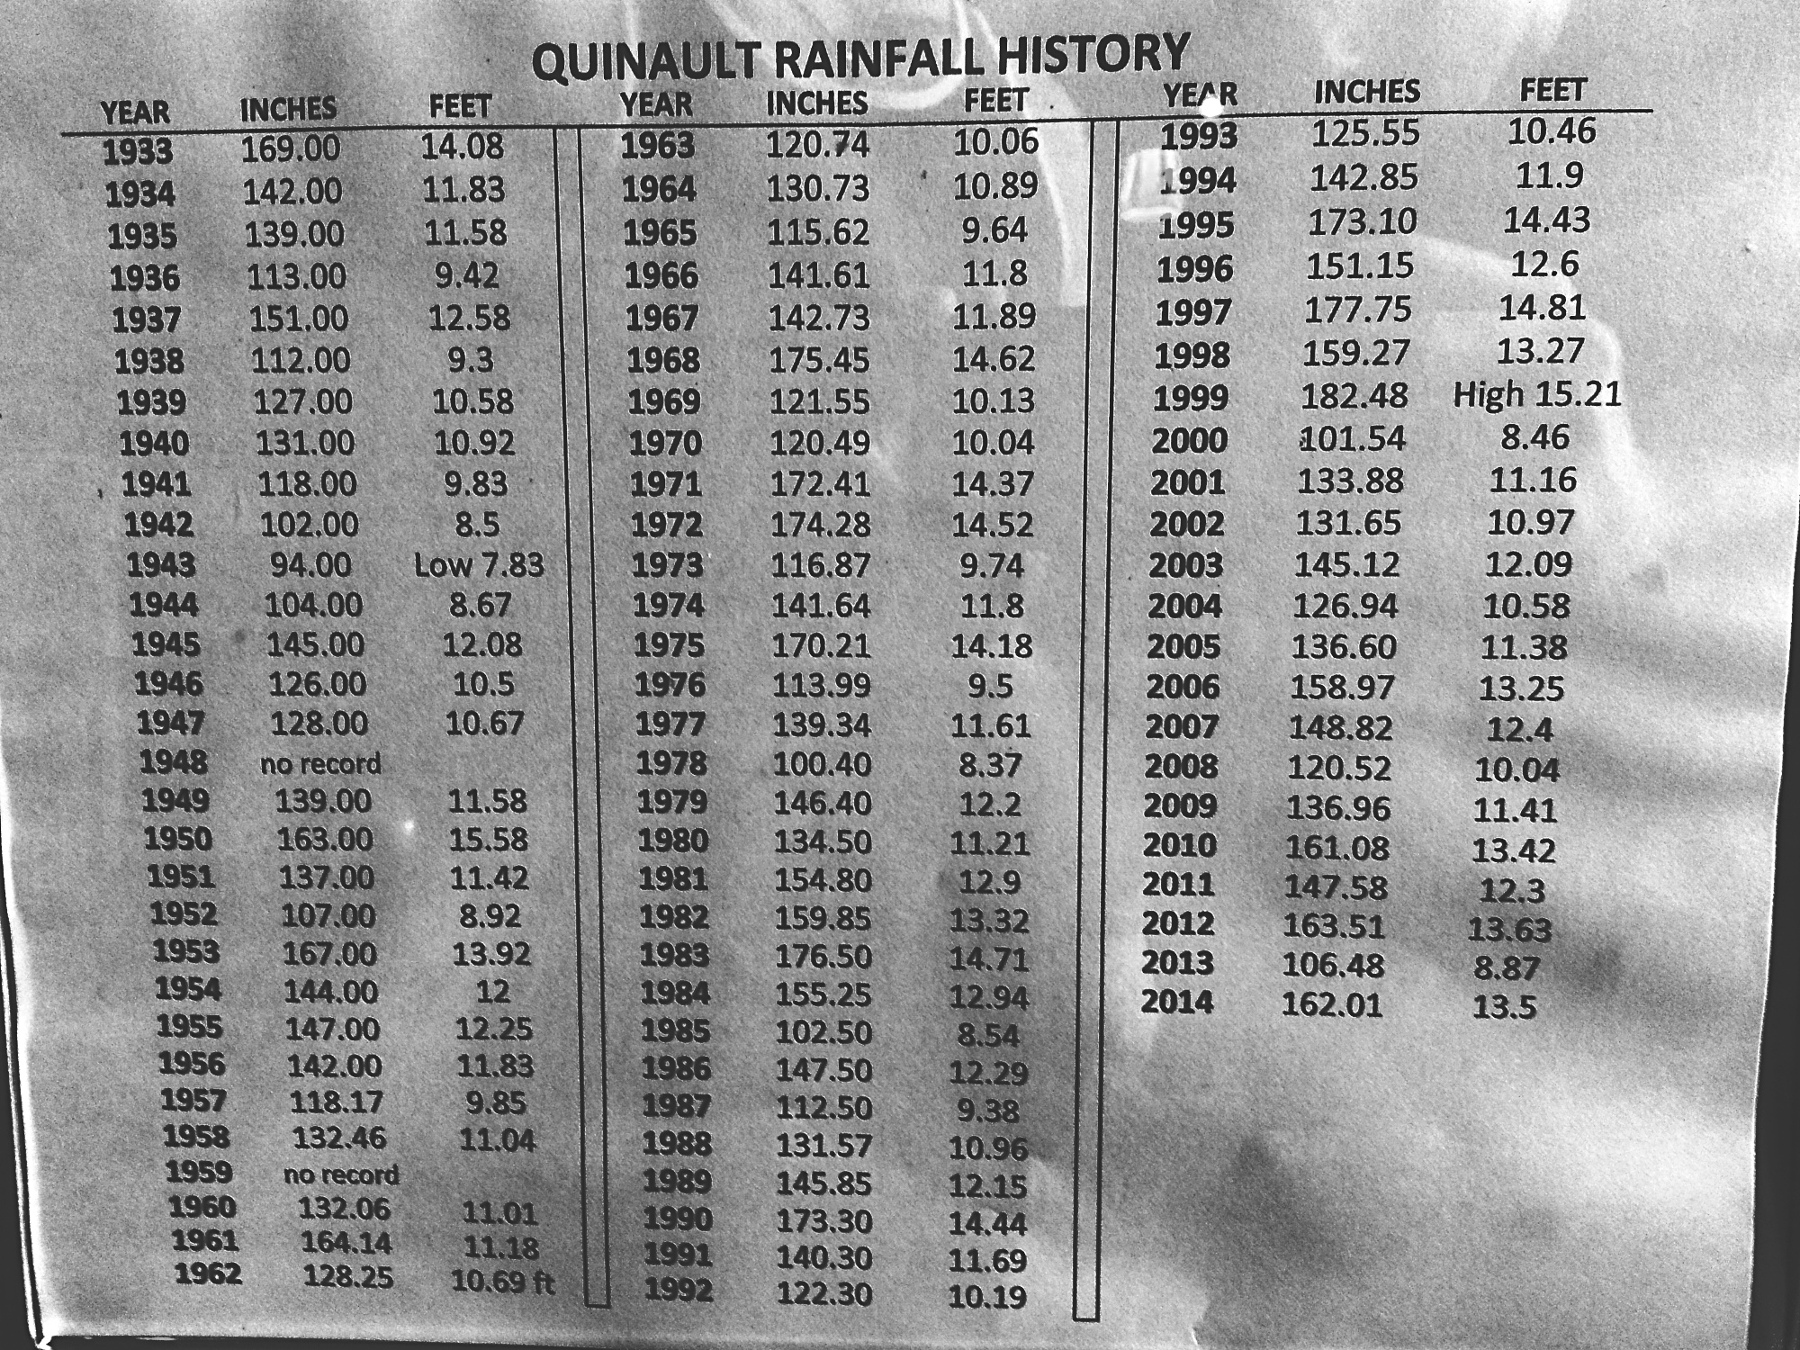
I decided to do some analysis of this data in R:
> Quinault <- read.csv("Quinault.csv")
> summary(Quinault)
Year FtRain
Min. :1933 Min. : 7.83
1st Qu.:1953 1st Qu.:10.18
Median :1974 Median :11.58
Mean :1974 Mean :11.57
3rd Qu.:1994 3rd Qu.:12.68
Max. :2014 Max. :15.58
NA's :2
> hist(Quinault$FtRain)
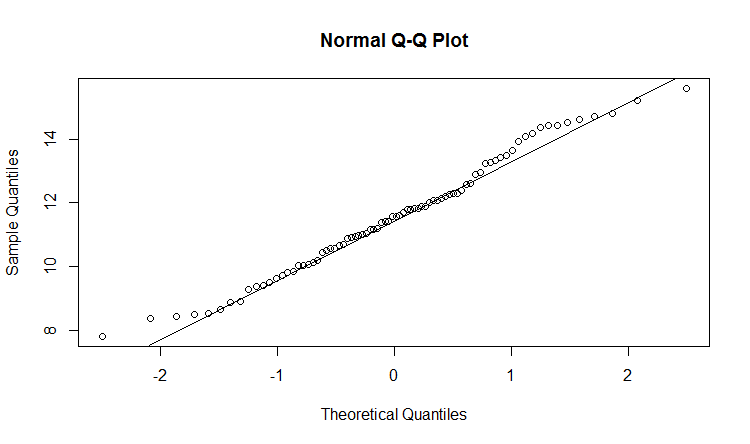
> qqnorm(Quinault$FtRain)
> qqline(Quinault$FtRain)
> plot(Quinault$Year,Quinault$FtRain,type="b")
> acf(Quinault$FtRain,type="correlation",plot=FALSE,na.action=na.pass)
Autocorrelations of series ‘Quinault$FtRain’, by lag
0 1 2 3 4 5 6 7 8 9 10 11
1.000 0.092 0.050 -0.015 0.104 -0.043 -0.116 0.003 0.087 0.031 -0.297 -0.005
12 13 14 15 16 17 18 19
-0.102 0.138 -0.080 0.227 0.136 0.005 0.045 -0.083
- The average rainfall is about 11 feet, 7 inches annually.
- Annual rainfall roughly fits a normal distribution. See the Q-Q plot below (a histogram, not shown, indicated a similar pattern).
- The strongest positive autocorrelation was with a 15 year lag.
Graphing the annual rainfall with a 15-year moving average smooths out a lot of the variability. Note that some researchers have suggested a 15 year El Niño cycle. I'm not sure if their theory has since been supported or disproven, but it seems like a good place to start when considering climate cycles in the Pacific Northwest.
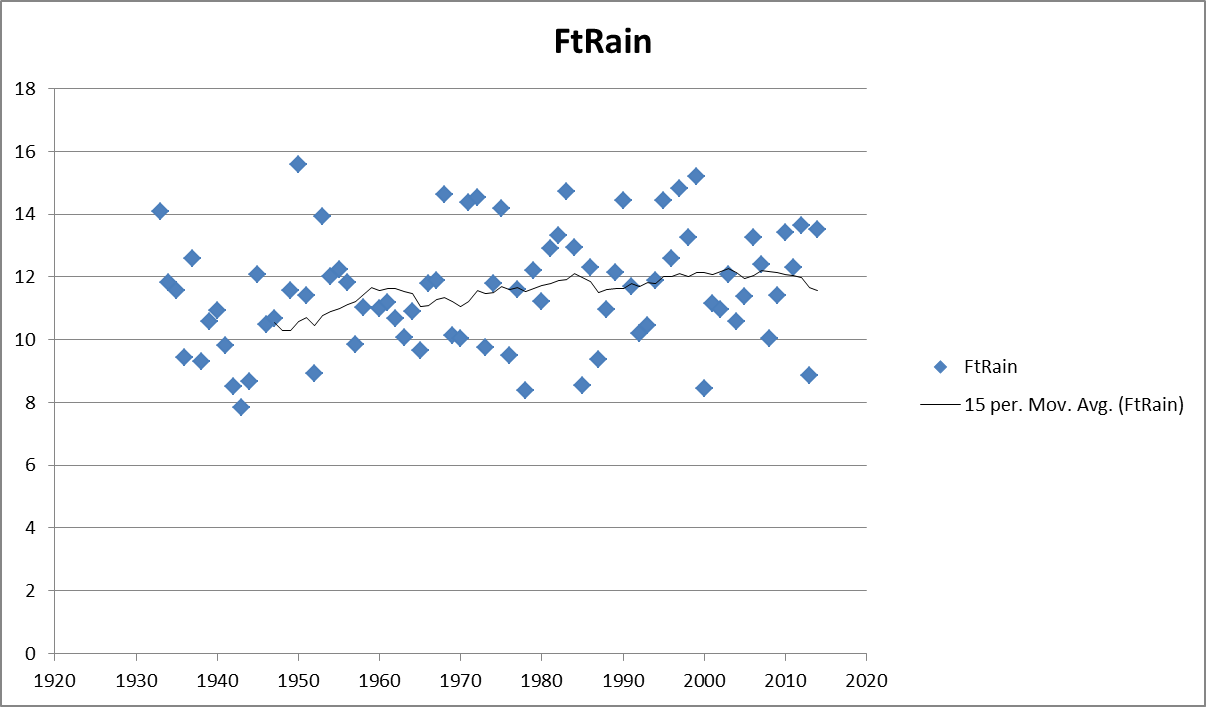
The moving average looks like it may have a slight upward trend, but I don't want to put too much weight on post-hoc analysis.
If you enjoyed this analysis, you might also like this post. I also have future ideas for blogging that were partially inspired by my visit to Olympic National Park: hiking at home (and elsewhere), wave dynamics (I even picked up a book on the topic at Powell's), mushrooms & mosses.