NB Budget 2015 - By the numbers
This is not a political blog, and I have no intention of making it one. However, I believe that it's important for all citizens of this province to be aware of our fiscal situation. I hope this post can serve as a useful summary of what is in the budget that was just released, and help put it in context.
(This week's post is early, to provide a timely source of information on the New Brunswick provincial budget for 2015 – 2016 that was released today)
If you live in New Brunswick and are paying any attention at all, you've probably heard that the provincial budget was released today. There is lots of news coverage and analysis of what programs got cut and which taxes were raised so I won't repeat much of that here. Instead, I want to provide a big-picture look: where is the province's money coming from? where is it being spent? what is the significance.
To aid with comparing different orders of magnitude, I've tried to write all amounts in millions of dollars (abbreviated M).
Most of this information comes directly from the budget document itself (I've noted some interesting page numbers at the end of this post). Other information comes from news coverage I've read today.
The Numbers
- The budget includes $8,310M of revenue and $8,630M of expenses (plus an extra $150M to start a "contingency fund"); this leads to a deficit of $477M.
- The provincial debt is projected to increase by $586M (which is more than the deficit because it includes capital expenditures), to around $12,600M by the end of this fiscal year (i.e. this time next year).
- $2,400M of the expenses in the budget are for payroll, per the CBC.
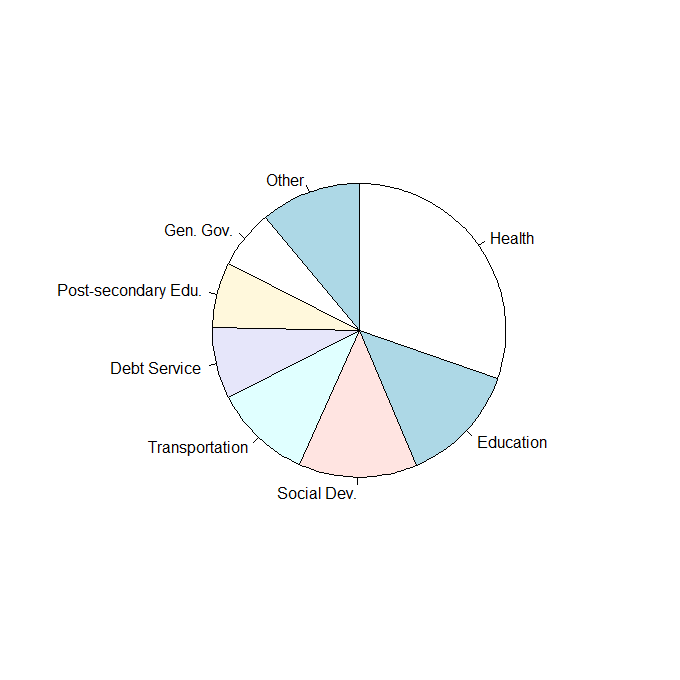
- Significant categories of expenses are shown in the first pie chart below. In order of cost come the departments of Health; Education and Early Childhood Development; Social Development; and Transportation & Infrastructure.
- Debt service is a larger expense than Post-Secondary Education & Training—making it larger than all but the top four departments.
- Social Development includes things such as nursing homes and long-term care facilities, which together account for more than half its departmental budget.
- Revenue is listed also by department in most places in the budget document, which is a little hard to decipher if you're not an accountant, since most revenue comes from the Finance department, which handles taxes and Equalization payments (other departments collect some license fees, leases, and royalties, etc.).
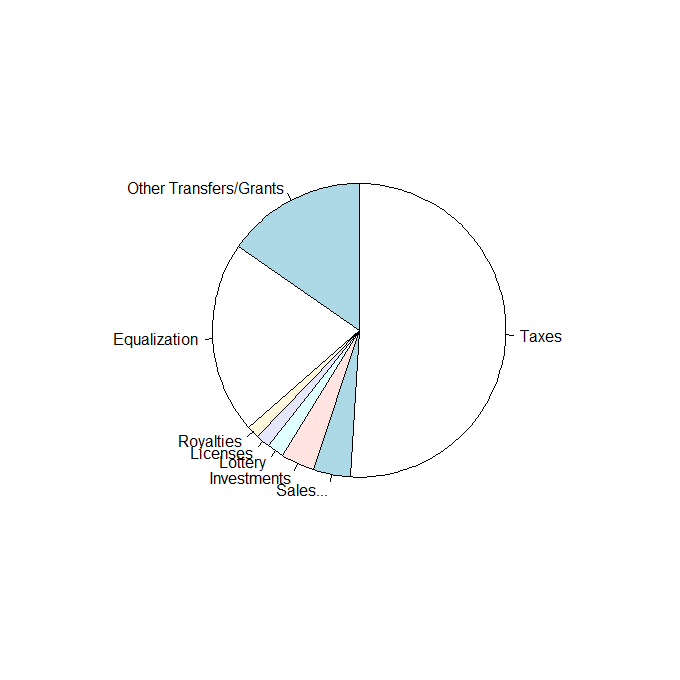
- However, there's also a break-down by different sources that I thought was more interesting. I made the next pie chart from this data.
- Taxes account for around half of total provincial revenue: $4,027M. This includes:
- Income tax, $1,587M
- HST, $1,184M
- Corporate tax, $258M
- Property tax, $488M
- Fuel tax, $268M
- Other sources of revenue collected by the province include:
- Sales of goods and services (intergovernmental billing, leases, user fees, etc.), $325M
- Investments (which appears to cover revenue from the Crown Corporations—NB Liquor and NB Power—but I'm not totally sure), $296M
- Lottery, $140M
- Issuing various licenses, $127M
- Royalties—more on this later!, $107M
- In addition to what is collected by the provincial government, funds totalling $2,881M are transferred from the Federal government. These comprise Equalization payments of $1,669M plus other transfers (mainly for health and education, which are administered provincially but partially funded from federally-collected taxes) and grants.
- Royalties collected by the Energy & Mines Department and the Department of Natural Resources had the royalty sources identified in the revenue tables for those departments. Here are some of the things we're getting royalties for:
- Timber, $86.8M
- Potash, $17.8M
- Peat Moss, $0.8M
- Salt, $0.55M
- Natural Gas, $0.5M
The Context
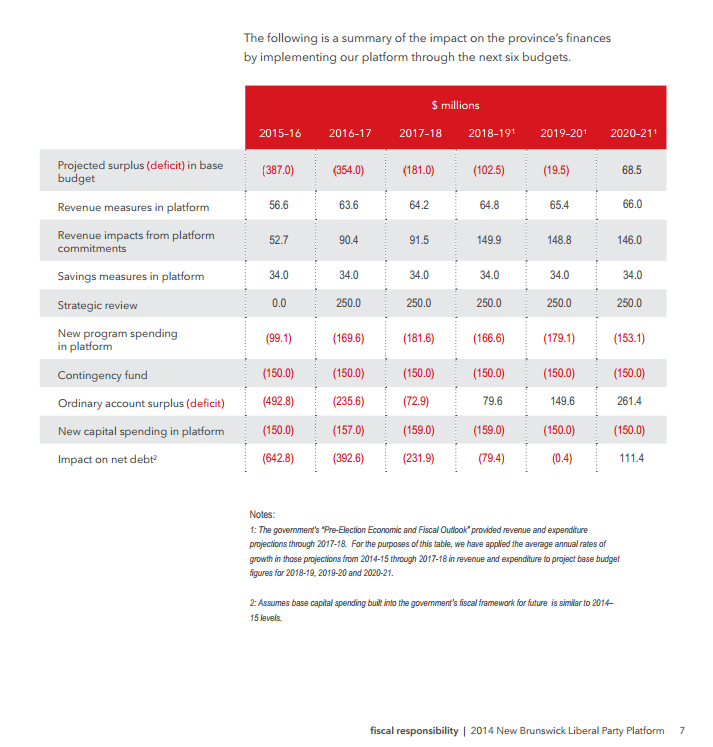
- The next figure is a table from the Liberal election platform. In their first budget after the election, the deficit came in $16M lower than projected in their platform ($477M vs $493M in the table).
- Keep in mind, however, that the 2015 – 2016 fiscal year hasn't happened yet—the budget document is a plan for spending and a forecast for revenue, not a record. The budget document contains revisions to the previous year's budget, which actually resulted in a lower deficit than expected for last year. The top row ("base budget") in this table should get a corresponding adjustment to accurately evaluate the progress of implementing the plan laid out in the Gallant government's platform.
- In my opinion, the greatest uncertainty in the budget lies with the tax revenue projections. If increases in taxes on high-earning New Brunswickers convinces some of them to move away, for example, the revenue received would not increase as much as expected. See this post I wrote on the "Laffer curve" for more exploration of this concept.
- Even before the latest tax increase, there are plenty of places people could move within Canada and pay less tax than in New Brunswick.
Finally, I'll try to put the size of the budget, deficit, and debt into context.
- New Brunswick's GDP is around $32,000M. Per capita, this works out to $42,500 which is around 10% less than the Canadian average.
- The provincial government accounts for around a quarter of the provincial economy.
- The deficit represents 5.4% of the budget. If NB's economy caught up with the rest of the country (i.e. grew by 10%—while holding expenses constant) and provincial revenues stayed at a constant percentage of GDP, it would balance the budget.
- The city of Detroit recently went bankrupt on their $18,000M debt. They have a similar population to New Brunswick (around 700,000 people), so from that perspective we're two-thirds of the way along the same path. However, the provincial debt is only a bit over one-third of GDP and our credit rating is still decent (Aa2—we benefit from the strength of Canada's national economy and institutions in Moody's analysis) so the situation is not hopeless at all.
- The Debt Service expenses in the budget are not only greater than many departments' budgets, but they are also greater than the deficit ($685M vs $477M). This might make it attractive to sell off some provincial assets to make one-off payments against the debt so that the accumulation of past deficits stops contributing so much to present and future ones.
- As a back-of-the-envelope calculation, the average interest rates for the province are around 5.4%. An increase in interest rates generally, or a downgrade to our credit rating in particular, could make it more expensive to carry the debt we have already and more difficult to get to a balanced budget.
- Equalization payments are around 20% of revenue for this province. I see that as a big risk going forward, especially now that the oil industry is slowing down. If "have" provinces like Alberta "have" less money to contribute to equalization then there is a large portion of the NB budget that will have to be made up for elsewhere.
- I was surprised by how small the contribution from royalties was. And that we get more royalties from peat moss and salt than from natural gas.
Page references in the budget document:
- p. 6: Overall budget statement
- p. 8 – 9: Expenses by department
- p. 173 – 175: Gross revenues by category
- p. 175: Equalization and transfer payments
- pp. 198, 219 – 221: Royalties
- p. 231: Net income from NB Liquor and NB Power