NB Budget 2016: In Context
Well, the NB provincial budget was released today. As I did last year, I wanted to show the actual numbers in a way that makes sense, with minimal commentary.
Sources
- This CTV summary article
- The Budget Speech document, delivered by the Hon. Roger Melanson
- The Main Estimates—any page number references are for this document unless stated otherwise
I didn't get into looking at the Capital Budget ($656M), but it can be found here.
Note that all amounts are in millions (M) of Canadian dollars.
Context: Where We Stand
Last year's budget projected $8310M in revenue and $8630M in expenses, leaving a deficit of $477M including a $150M contingency reserve. The first thing I looked at in this year's budget was how close the 2015 fiscal year (2015 – now) projections were. Total revenue came in a bit lower than projected and total expenses came in a bit higher, but the contingency reserve (circled in the image below) was lowered to $100M so the deficit ended up being $466M.
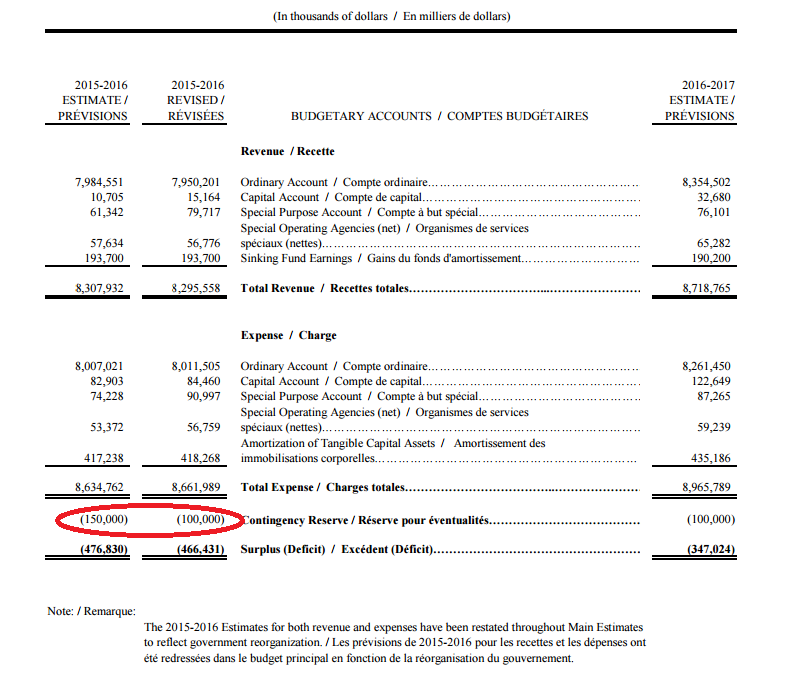
This year the projected expenses have increased to $8966M (I think this includes capital spending), while projected revenues have only increased to $8719M which leaves a deficit of $347M after the $100M contingency reserve is included. The provincial government plans to keep narrowing the gap between expenses and revenues (i.e. the deficit) by addressing both sides of the equation to eventually balance the budget in 2020. See page 20 of the budget speech for a table summarizing the multi-year plan. Compared to the table in my post last year showing the Liberal Party's election platform, the deficit this year and the plan to reach a balanced budget in 2020 are more-or-less on track with the key modification of a shrinking contingency reserve.
By the end of March 2017, the total provincial debt is projected to be $13500M ($13.5 billion). The net change in the debt includes the ordinary account deficit plus capital spending less tangible asset depreciation.
I don't have space to cover everything, so go to the speech document linked above or to media coverage on the provincial budget for information on cuts to civil service jobs, consolidation of some facilities, and how tax rates are changing.
Context: Revenue and Spending this Year
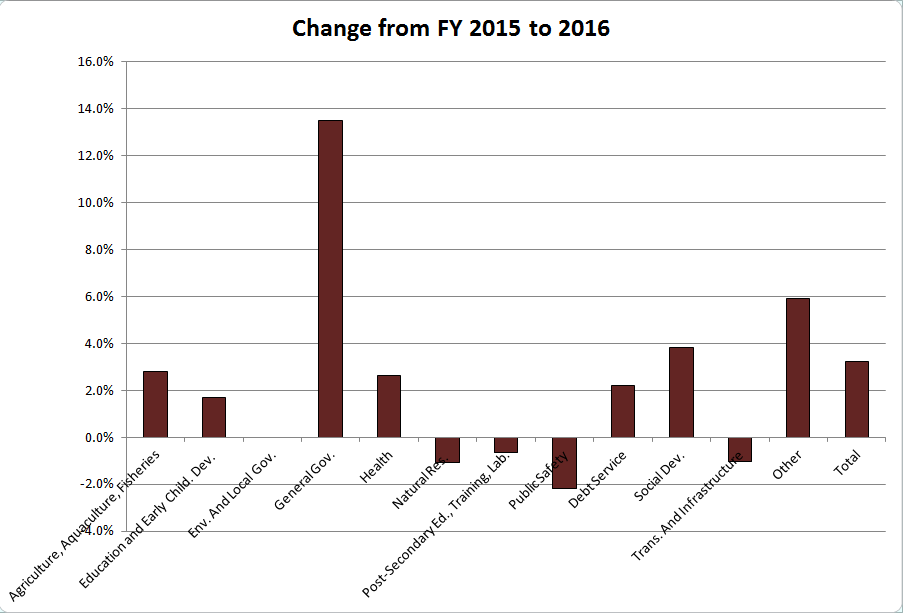
I made this graph by comparing the ordinary account (not including capital budgets) expense projections for key departments—all of the ones with budgets over $100M, plus Agriculture & Aquaculture and the Dept. of Natural Resources—between the fiscal year ending now (in March, to be precise) and the upcoming one:
Here are a few things to note:
- Total spending is actually increasing by a bit over 3% from last year. This is more than the provincial economy grew.
- The three biggest departments (Health, Education, and Social Development) are all increasing their spending.
- The biggest cuts are to the departments of Post-Secondary Education, Transportation & Infrastructure (at least their ordinary operating budget; this is the department that manages most of the capital spending), and Public Safety.
- The cost of paying interest on the province's debt has increased by a bit over 2%.
- The really big increase is in General Government. This department is responsible for pensions, which account for the increase (Gen. Gov. also covers functions such as First Nations' relations, Service New Brunswick, and various boards).
See my post last year for a breakdown of the percentage of the budget taken up by each department.
Context: Interprovincial Comparison
I thought it would be useful to compare New Brunswick's budget to another province. I picked Saskatchewan, because they have a population that is not hugely larger (~50%) but their economy has been growing much better (at least until this year; we'll see what happens now that commodity prices have fallen drastically) and they have had a string of balanced budgets.
I used this article from CTV as my source of information on Saskatchewan's budget. Note that it is from last year since they haven't released this year's budget yet.
Here is a comparison of various sources of revenue between Saskatchewan (SK) and New Brunswick (NB):
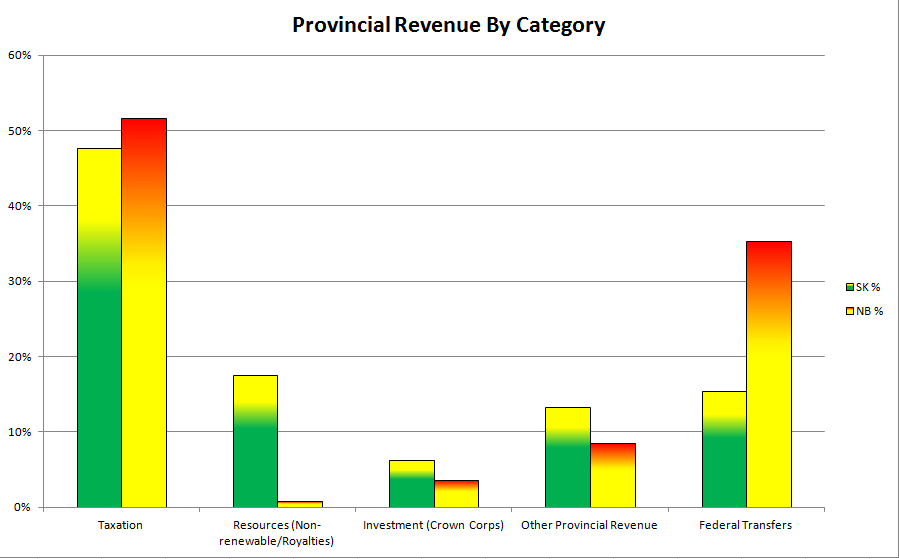
- Saskatchewan has significantly lower tax rates: the top individual tax bracket is 15% compared to 20.3% in NB—lowered from 25.75% in today's budget— and the corporate tax rate (small business pay a lower rate in both provinces) is 12% compared to 14% in NB—raised from 12% in today's budget. In spite of this, there is not much difference in the relative contribution of taxes to revenue (Saskatchewan takes a narrower slice of a larger pie, basically).
- Resource royalties are a much larger contribution to revenue in Saskatchewan.
- New Brunswick gets more Federal transfers (a category that includes Equalization payments, among other things). Equalization payments are intended to give provincial governments comparable levels of finances to work with and that's how it works out in this comparison: Saskatchewan has $12,700 (not million) in total revenue per person and New Brunswick has $11,100 per person.
Here is a comparison of expenditures between the provinces. Note that the way each province classifies functions or divides up responsibilities between departments doesn't line up perfectly, so I had to group some things together and make assumptions in some cases about which departments were roughly equivalent (this is also true for the graph above, but it's more of a challenge on this one).
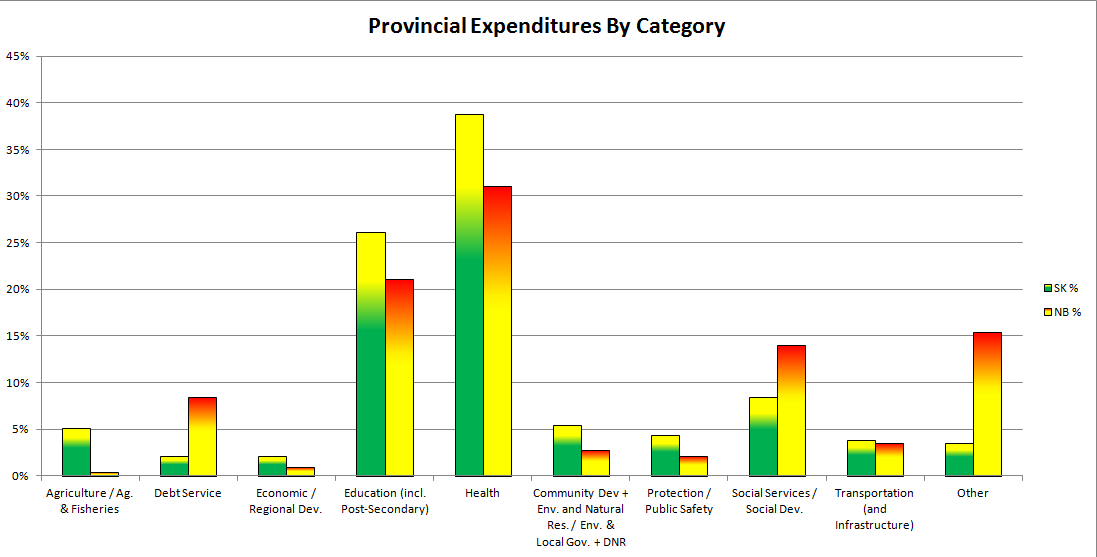
The main point I want to point out from this graph is that New Brunswick spends much more on debt service, which leaves Saskatchewan free to spend more on education and health.