NB Budget 2022: Staying Healthy
New Brunswick would appear to be in a very reasonable neighbourhood when it comes to several healthcare metrics (per capita): spending, acute care beds, hospitals, and physicians. So why does the system feel so strained?
My latest annual overview of the New Brunswick provincial budget. This one includes a look at the fundamentals underlying its biggest component: healthcare.
As per usual, I'll try to keep most of the amounts in millions (M) of dollars (CAD) because I think it's easier to compare than mixing million and billions. And while I'll mostly refer to it as the 2022 budget, it is technically for the 2022-2023 fiscal year. As per usual, I'll try to focus on the facts and figures rather than opinion/commentary.
Updates on Expenditures and Revenue
To start with, here are some of the key estimates in the provincial budget for the fiscal year ahead:
- Projected total revenues of $11346M
- Projected total expenditures of $11311M
- A projected surplus of $35M
- Projected net debt of $12977M this time next year
The net debt by the end of the fiscal year will represent around 30% of provincial GDP (assuming the economy stays relatively stable). It is also almost back to the point it was when I started writing these posts in 2015 (i.e. $12600M).
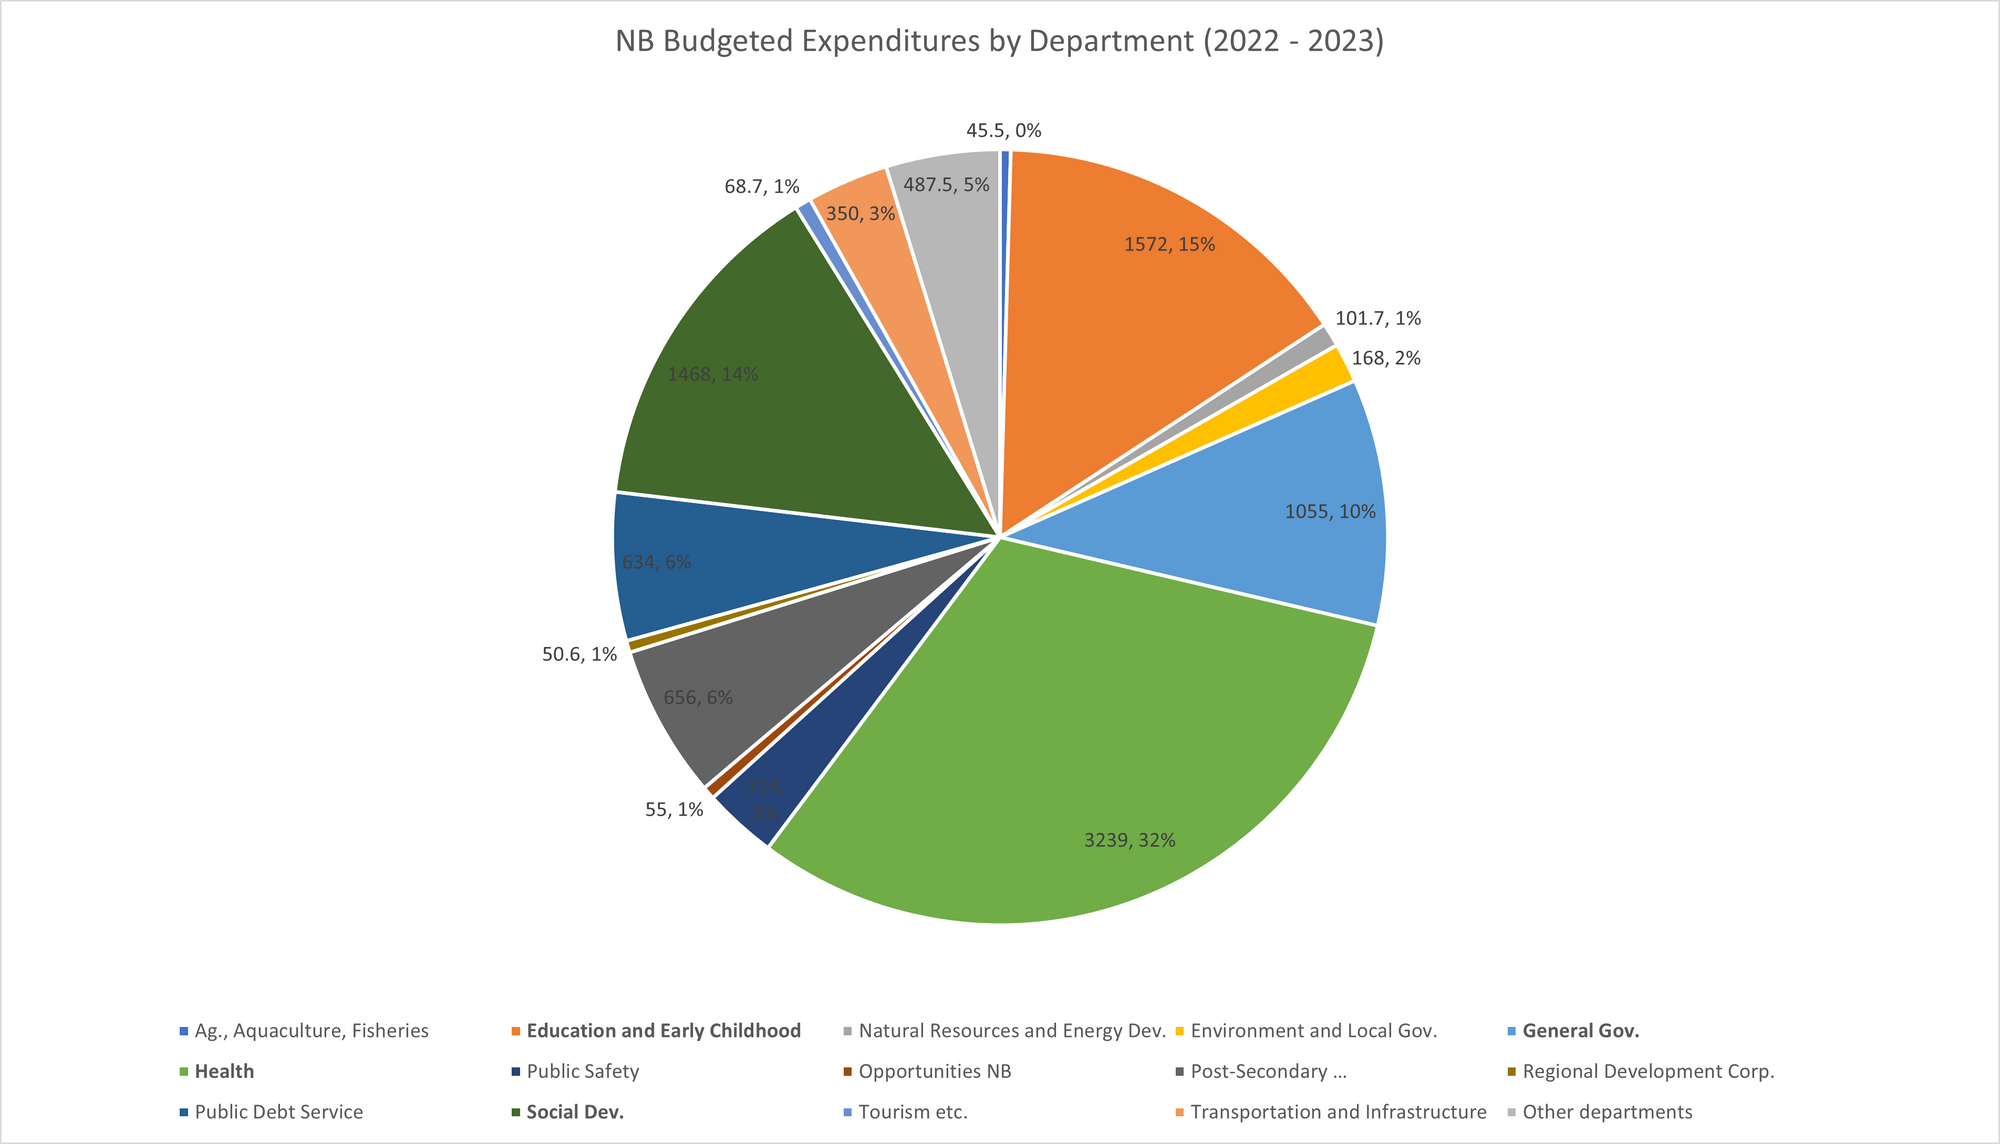
The departments with the largest budgets for the upcoming fiscal year are as follows (these figures and the following graph are for their ordinary accounts which don't include capital spending, amortization, etc.):
- Health: $3239M
- Education and Early Childhood Development: $1572M
- Social Development: $1468M
- General Government: $1055M
- Post-Secondary Education, Training, and Labour: $656M
- Debt Service: $634M
- Transportation and Infrastructure: $350M
- Public Safety: $314M
There was a 5.5% increase in the funding for the department of health and an 11.4% increase in the funding for the department of education and early childhood development over what was budgeted last year (these increases are approximately the same absolute value, and the different percentages reflect the different starting sizes of these departments). The department of social development had a 7.5% increase; the largest increase (and largest sector of that department overall) was to seniors and long term care, now at $860M. The department of tourism and heritage had an 11.3% increase. Finally, the general government category had a 13.3% increase; major expenses in this category include pensions and benefits for MLAs, judges, and government employees ($430M all together), the operations of Service New Brunswick ($194M), and a supplementary fund for responding to the settlement of collective bargaining agreements and unanticipated events.
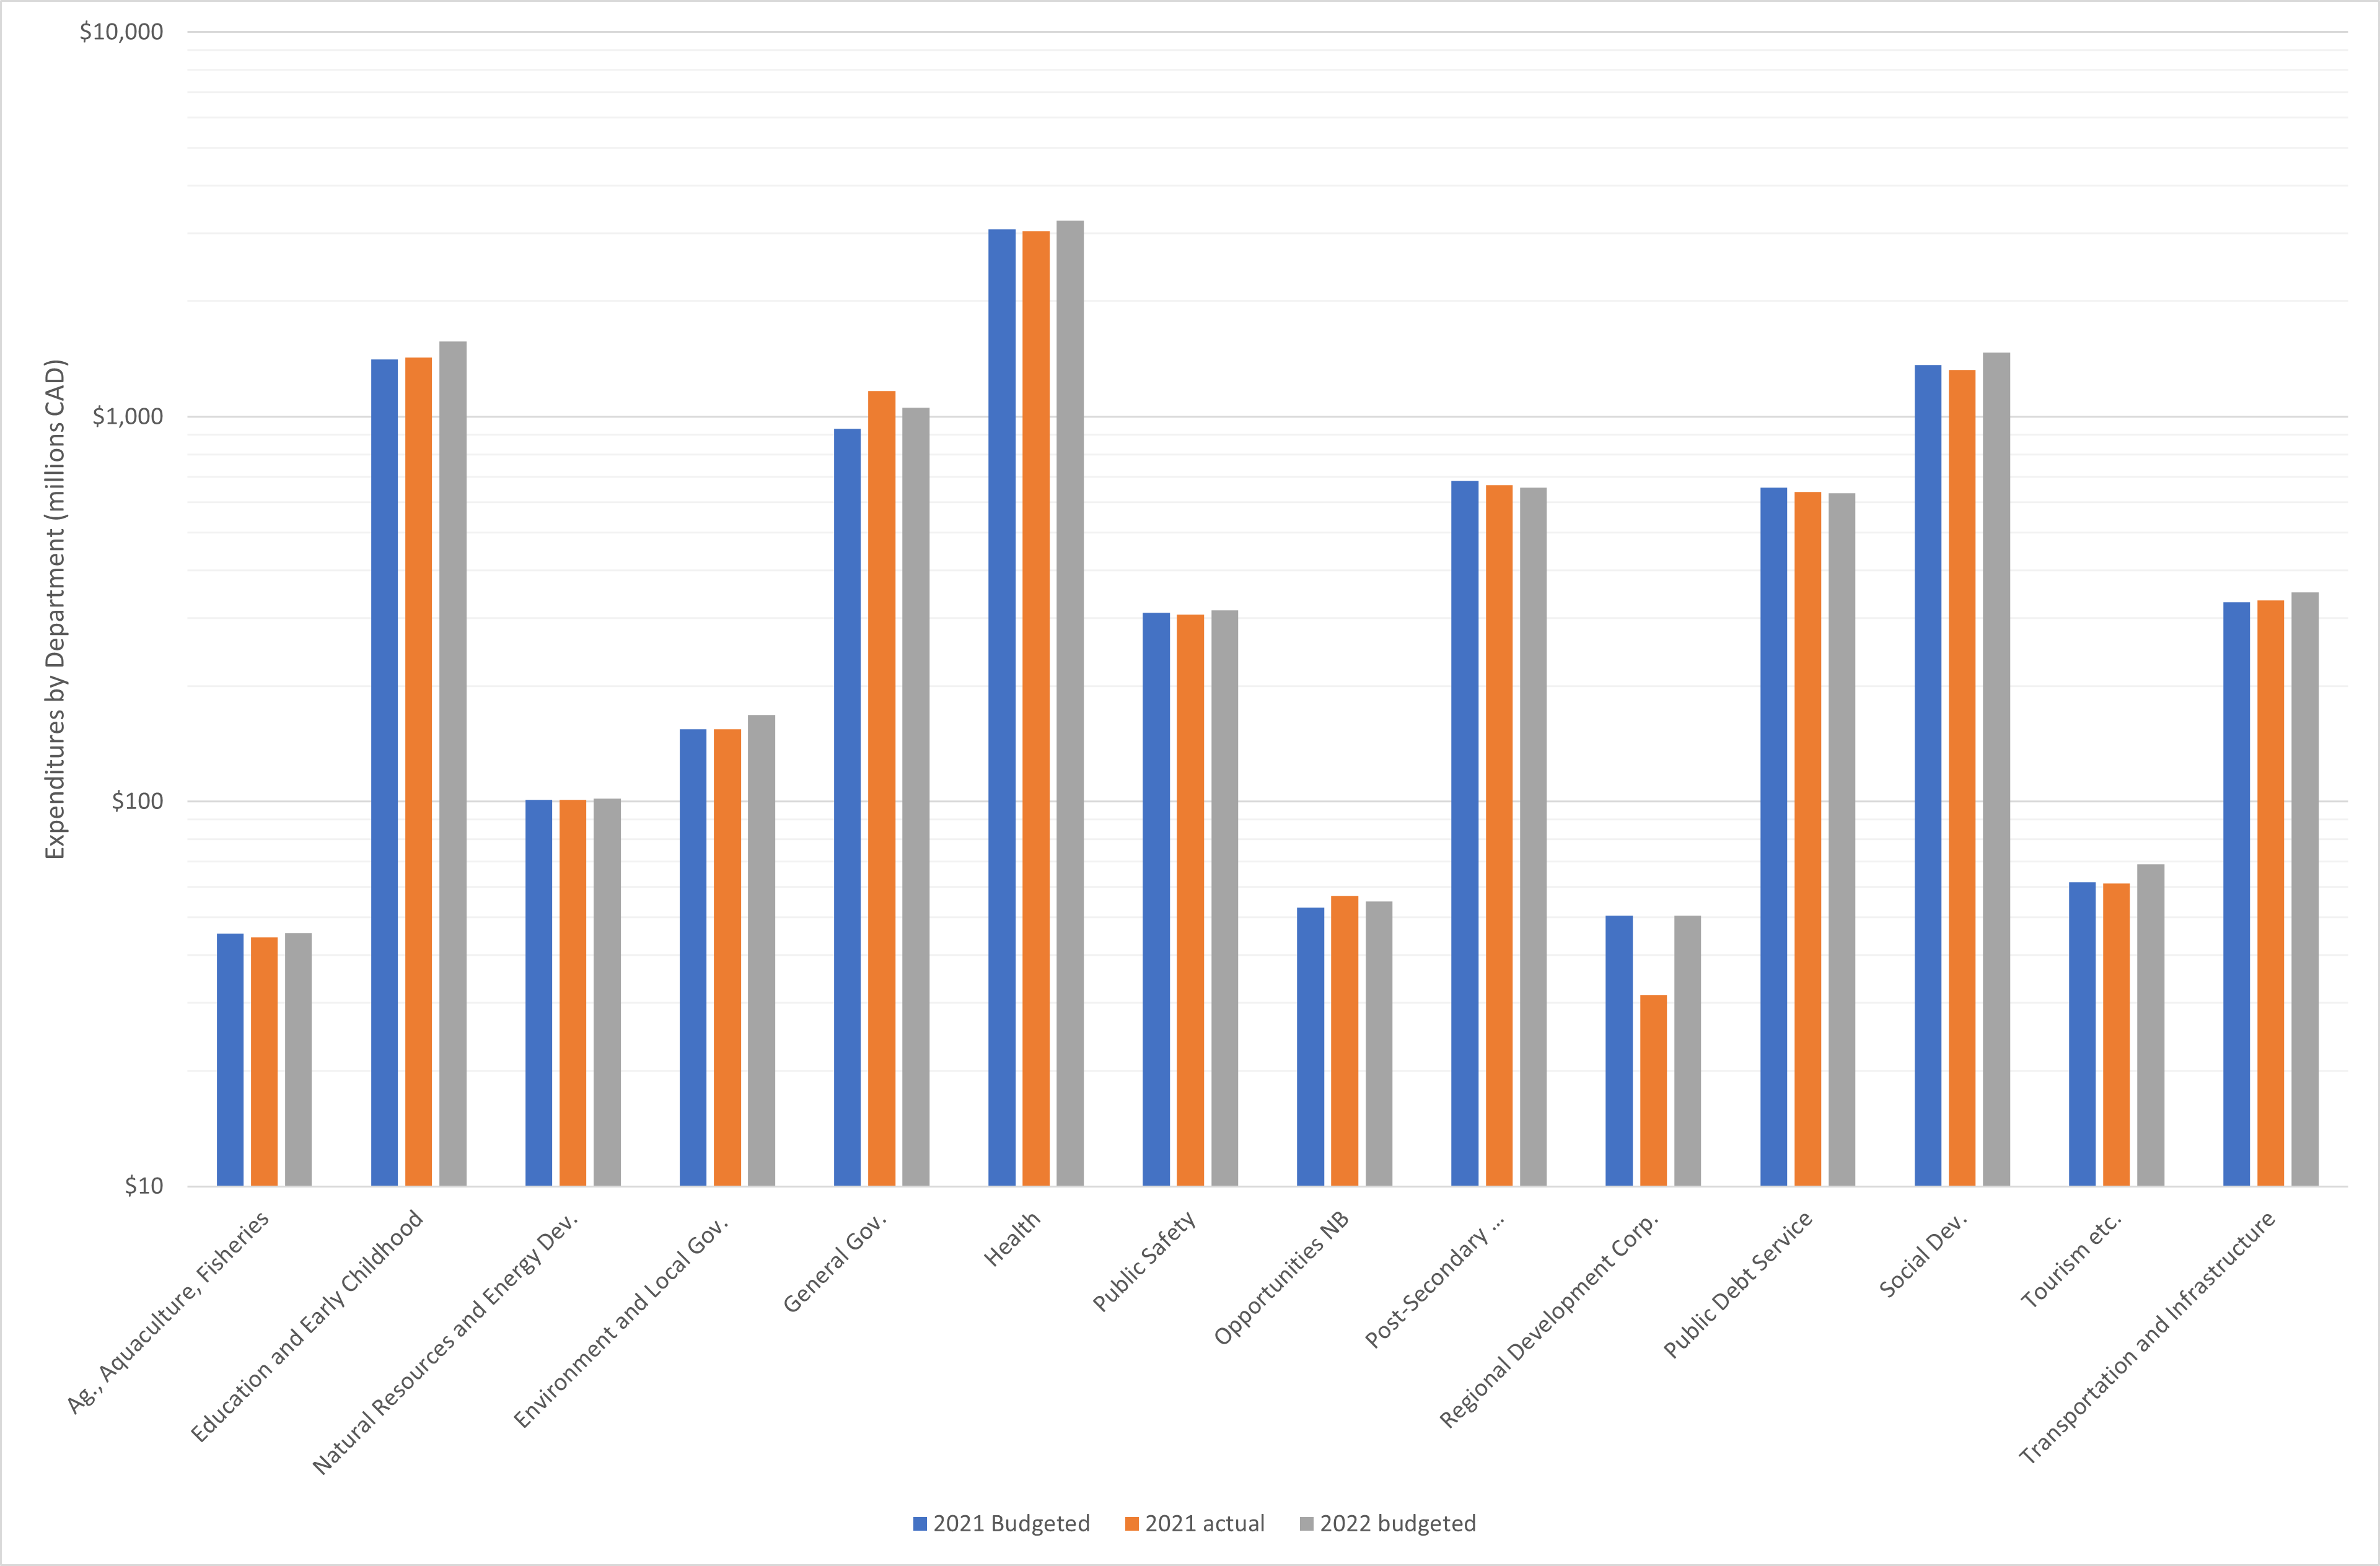
Here are a couple of graphs: a pie chart of spending by department, and a comparison (on a log scale, since departments have sizes that vary over a couple orders of magnitude) of the budgeted and actual spending from last year and the budget for the fiscal year to come.
Before moving on to the details of provincial revenue, I'll note (setting up the discussion below) that spending on healthcare is greater than any source of revenue: income taxes (personal + corporate) are $2441M, all other taxes are $2998M, and equalization payments are $2360M. In 2015 when I started doing these budget review posts, spending on healthcare was 2617M. It has gone up almost 25% in the intervening years, an average of 2.8% per year. This is above inflation, which totalled 17% over the same period. However, healthcare has actually fallen slightly as a proportion of the total budget from 30.3% to 28.9%. This illustrates the difficulty in any drastic increases to healthcare funding. Since it is already the largest department by far, increasing its share of the pie would require significant cuts elsewhere or major new sources of revenue.
On the revenue side of the 2022 budget, the major anticipated sources of revenue for the Government of New Brunswick include:
- Taxes: $5439M
- Equalization Payments: $2360M (this is the single largest line item, since there are multiple types of taxes: income, sales, property, corporate income, gas, carbon, tobacco, etc.)
- Other grants from the Federal government: $1725M
- Other self-generated revenue (Licenses, Royalties, Lottery, Etc.): $1255M
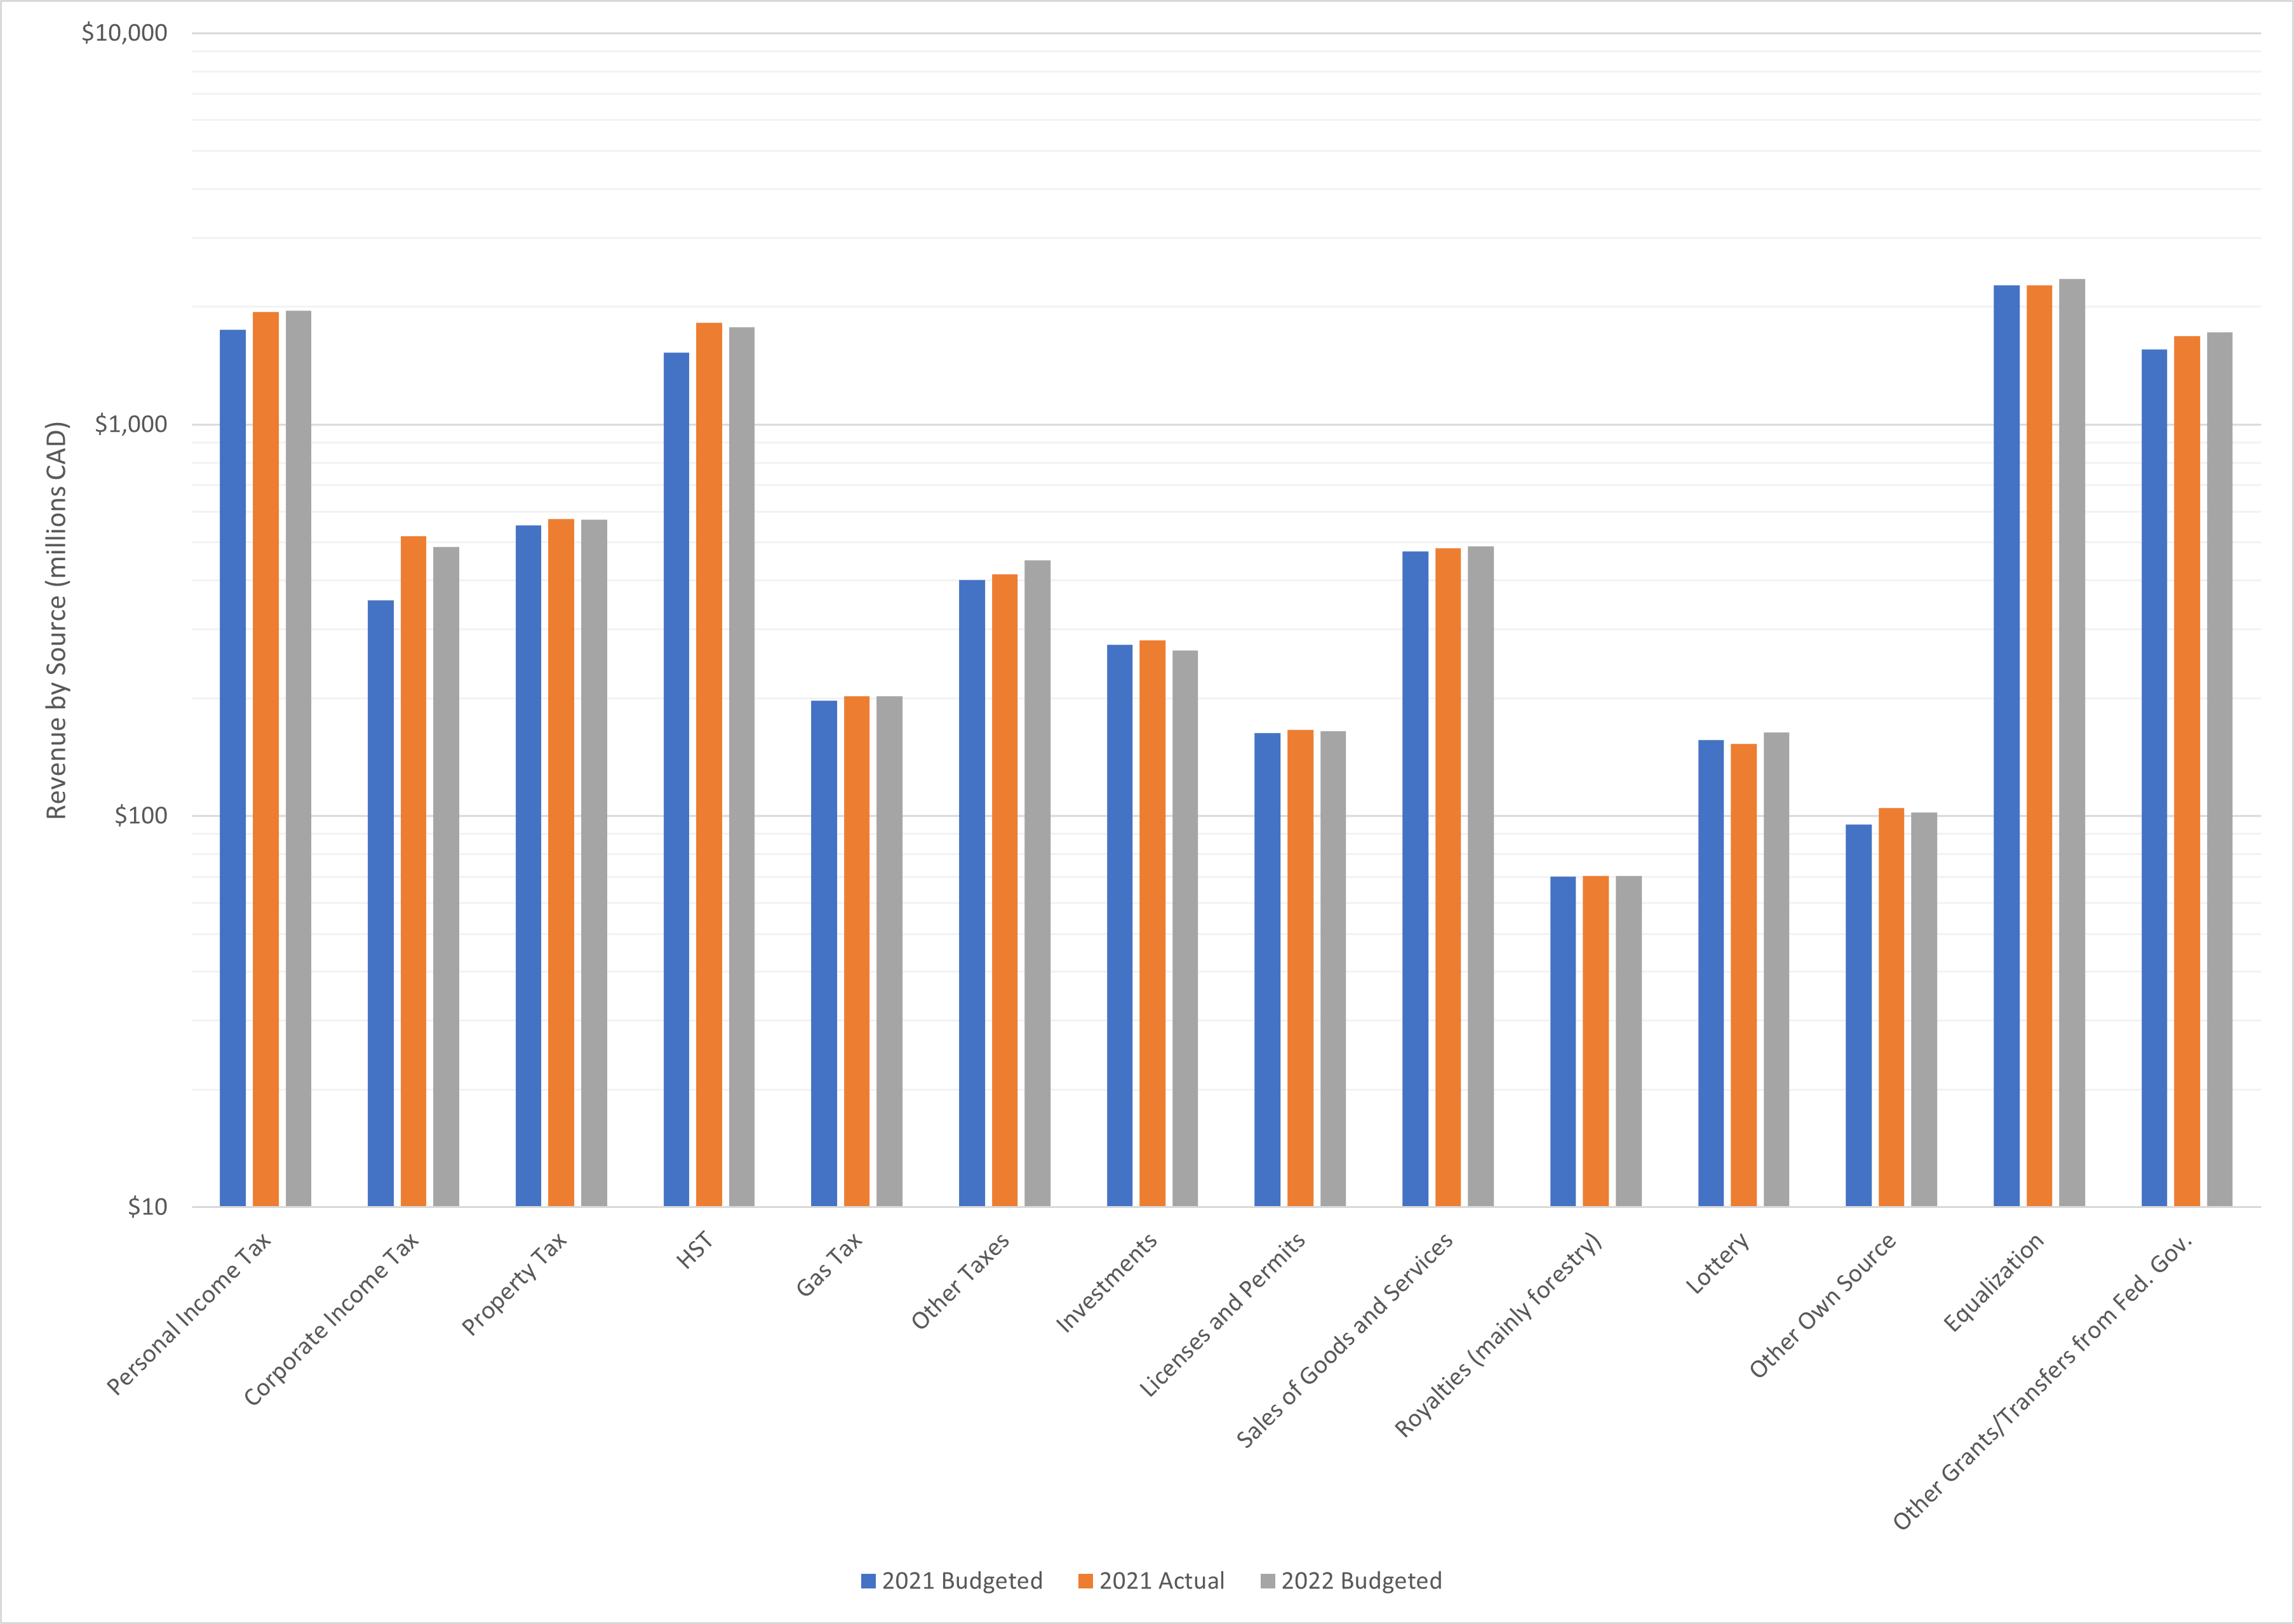
Last year, the revenue from taxes in NB came in $690M higher than budgeted. I guess the government was anticipating the economy to struggle more than it did with the second year of the pandemic. Where there are changes in the forecasted revenue for this year, they generally assume it will be closer to how last year turned out than to what last year's budget anticipated.
The biggest tax-related change to note is that the double property tax on apartment buildings (relative to owner-occupied residences) will be phased out to bring them in line with other residential properties. In exchange for the reduced costs incurred by landlords (in the short term anyway, until assessment values reach a new equilibrium), a one-year cap (to 3.8%) on rent increases has been imposed. See this article and the government press release for more.
Here is a graph of revenue by source comparing the budget for the current year with the budget and actual revenue from the fiscal year just ended:
Healthcare Costs and Context
In this section, I'll explore the fundamentals that our healthcare system has to deal with, which are heavily related to demographic trends. Two words tell much of the story: aging population. Elderly people have a much higher need for medical care; furthermore, as the working age population shrinks in proportion to retirees, there is a relatively smaller tax base to pay for government services like healthcare and also a smaller pool of potential employees to recruit from (within our borders anyway) to work in that sector. I'll also look at comparative data to other provinces and countries, and temporal trends in terms of staffing.
To start with, I found the table here to be incredibly informative. It allows you to compare a Canadian province to several OECD peer countries on a number of health-related metrics (the data is from 2018, so should still be pretty current). I encourage everyone to click through and read the whole thing, but here are some things that stood out to me:
- Spending on healthcare in New Brunswick is about $300 (6%) more than the Canadian average per capita and within plus or minus 10% of the averages for Australia, France, the Netherlands, and Sweden (all in US dollars, with a purchasing power parity correction)
- Acute care beds in NB are also higher than the Canadian average (2.9 per thousand vs 2.0) and right on par with the peer country average
- Obesity is higher in NB (by a wide margin) than any other jurisdiction in the table aside from the United States. Smoking prevalence, however, is below the peer country average.
- The percentage of seniors in the population is higher than the Canadian average, although in line with some peer countries such as France and Sweden.
Looking at the number of hospital establishments per capita (source here), New Brunswick is also ahead of the Canadian average: 5.3 per 100,000 people vs 3.3. However, Newfoundland, Manitoba, PEI, and Saskatchewan all have more (and I think the territories do as well, although I didn't calculate the per capita rate for them). This makes sense as rural, spread out populations need a larger number of smaller hospitals to provide geographic coverage. Still, it's well worth noting the way that more urbanized provinces can benefit from economies of scale here.
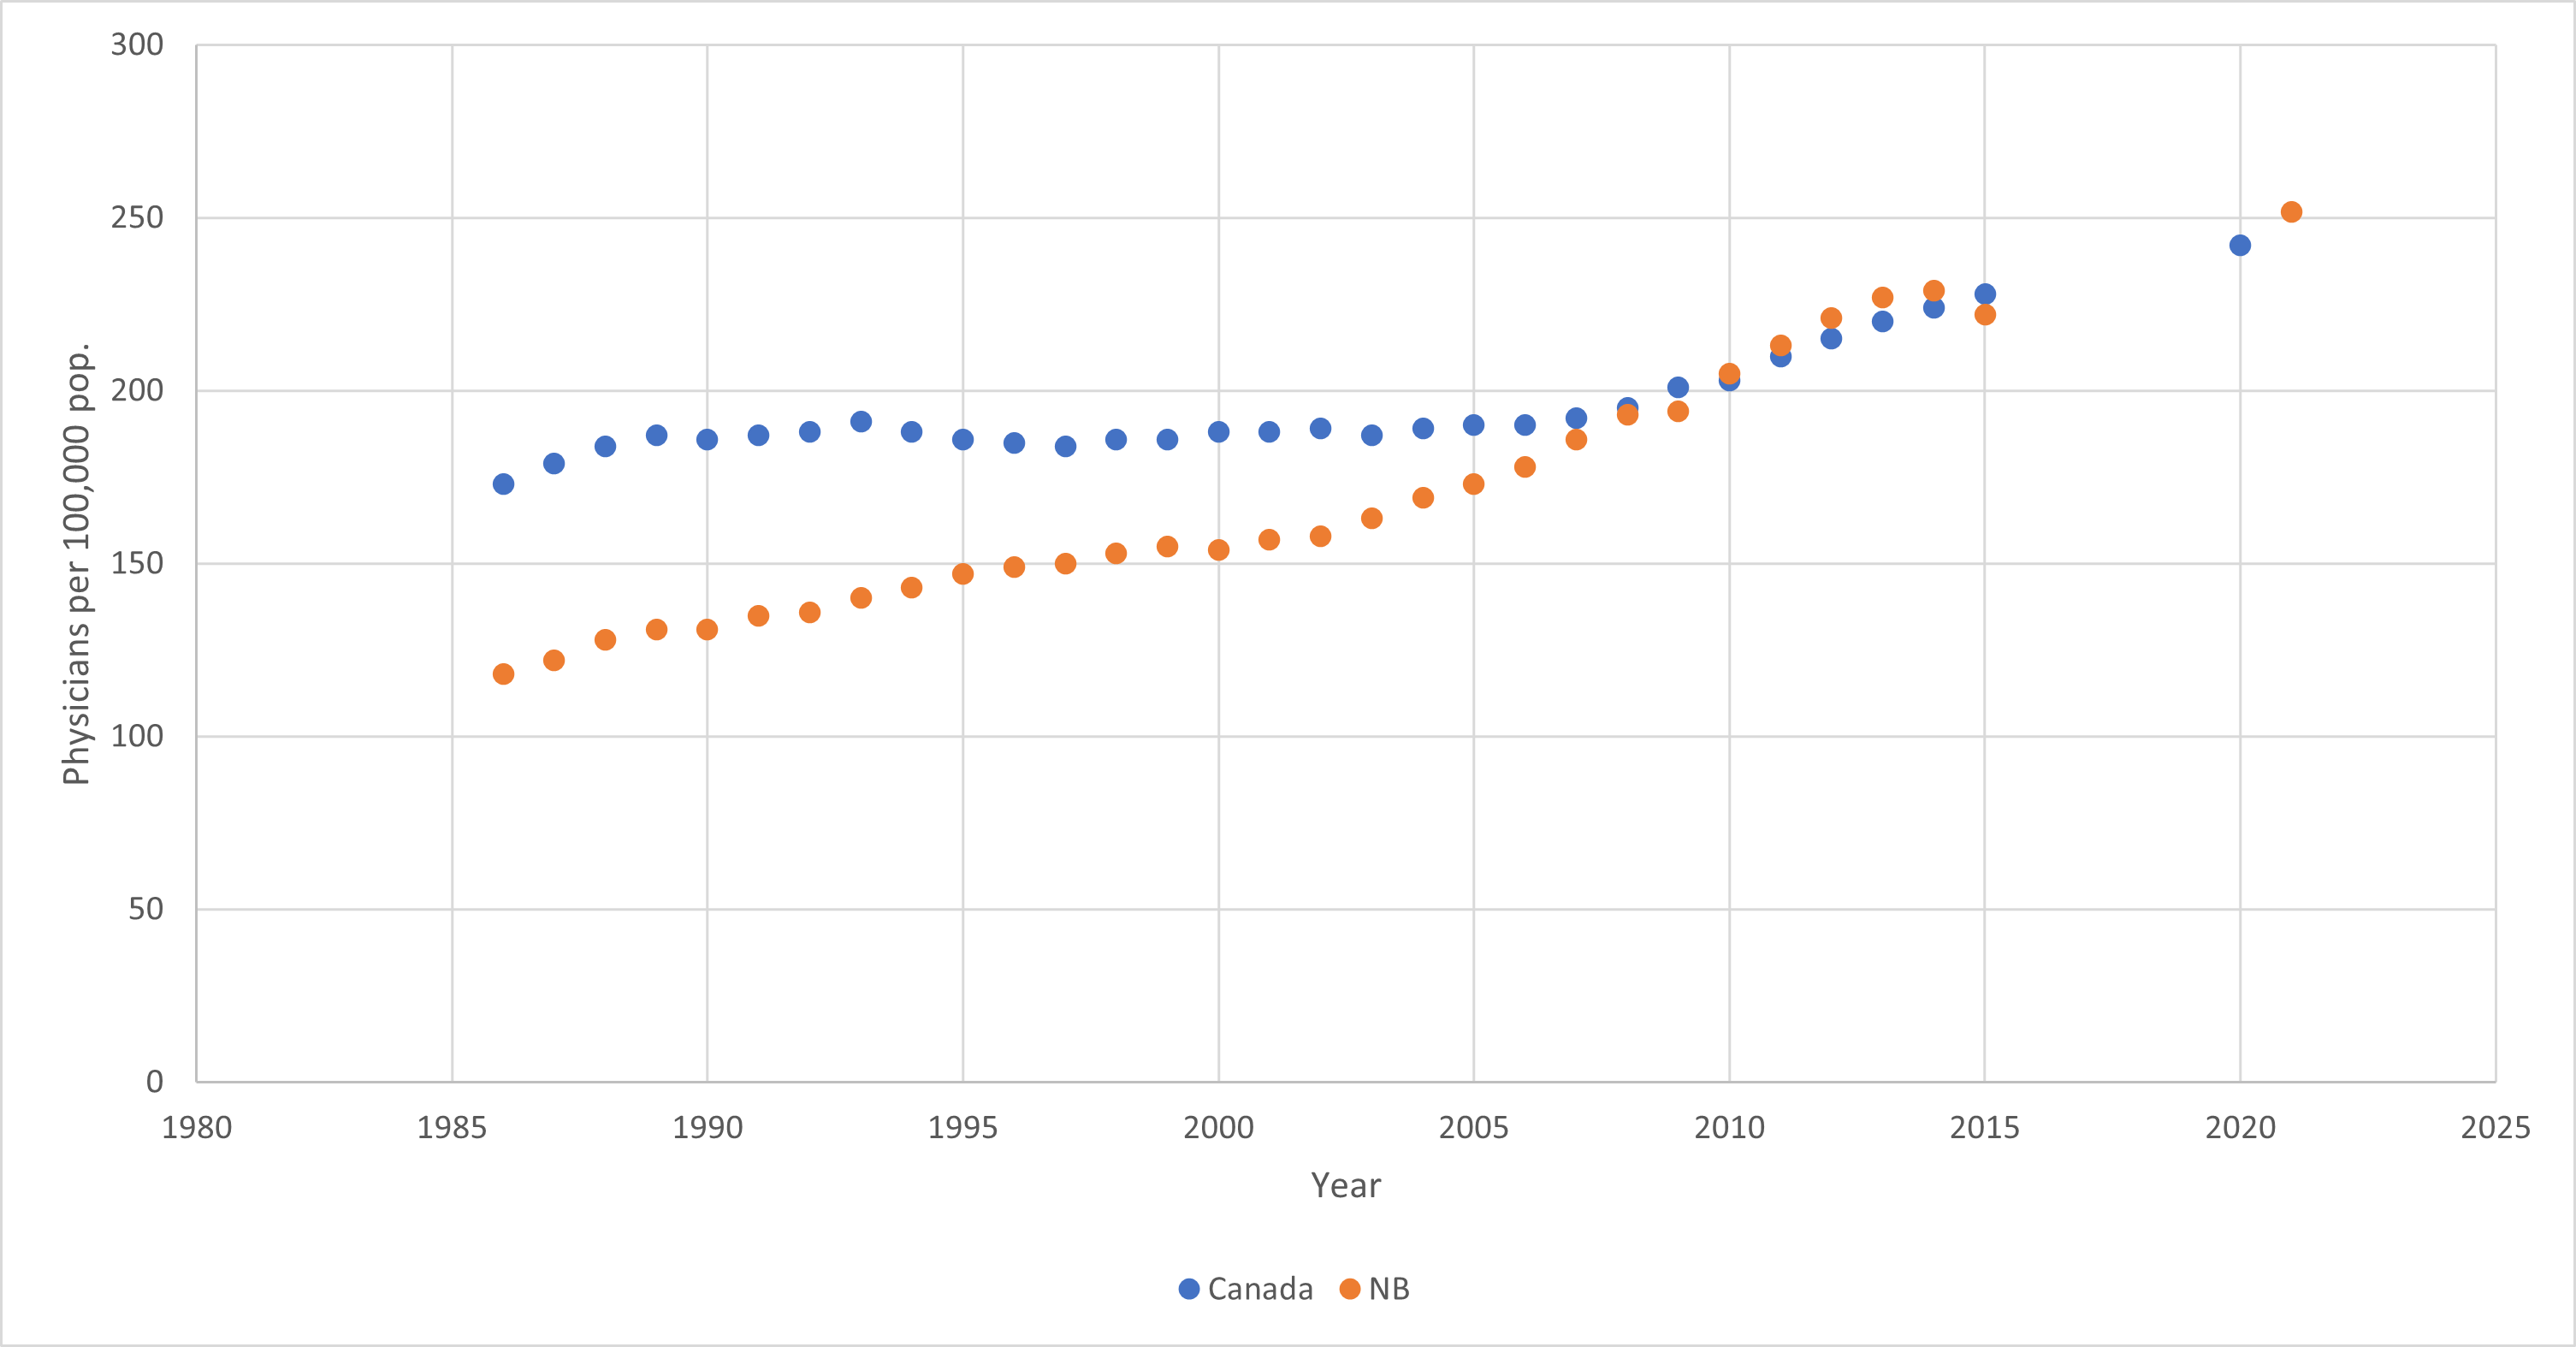
I made the following graph of physicians per capita from the data here (up to 2015, with supplemental more recent data points for Canada and NB). The number of physicians per capita in NB has increased by 85% over the past 3 decades.
Bringing this all together, New Brunswick would appear to be in a very reasonable neighbourhood (considering the rest of Canada and peer countries) when it comes to several healthcare metrics: spending per capita, acute care beds per capita, hospitals per capita, and physicians per capita. So why does it feel like the system is so strained?
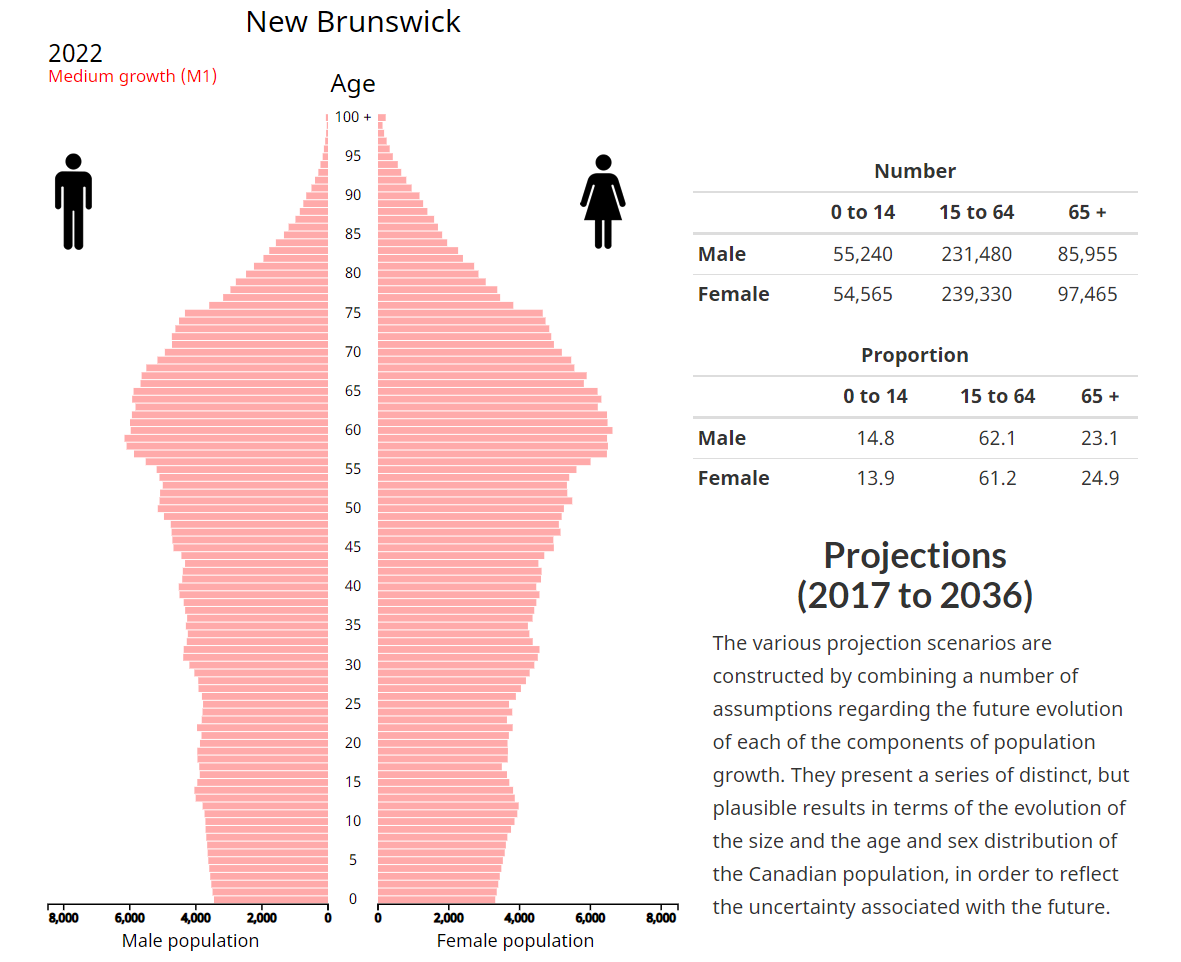
Statistics Canada has an interactive feature where you can explore the shape of the population pyramid (the number of men and women at each age) for different provinces or the country as a whole. It is based on census data until 2016 and then demographers' projections after that (I used the medium growth scenario). Here is the population pyramid for 2022. Note the bulge of Baby Boomers who recently became seniors or will before the decade is out:
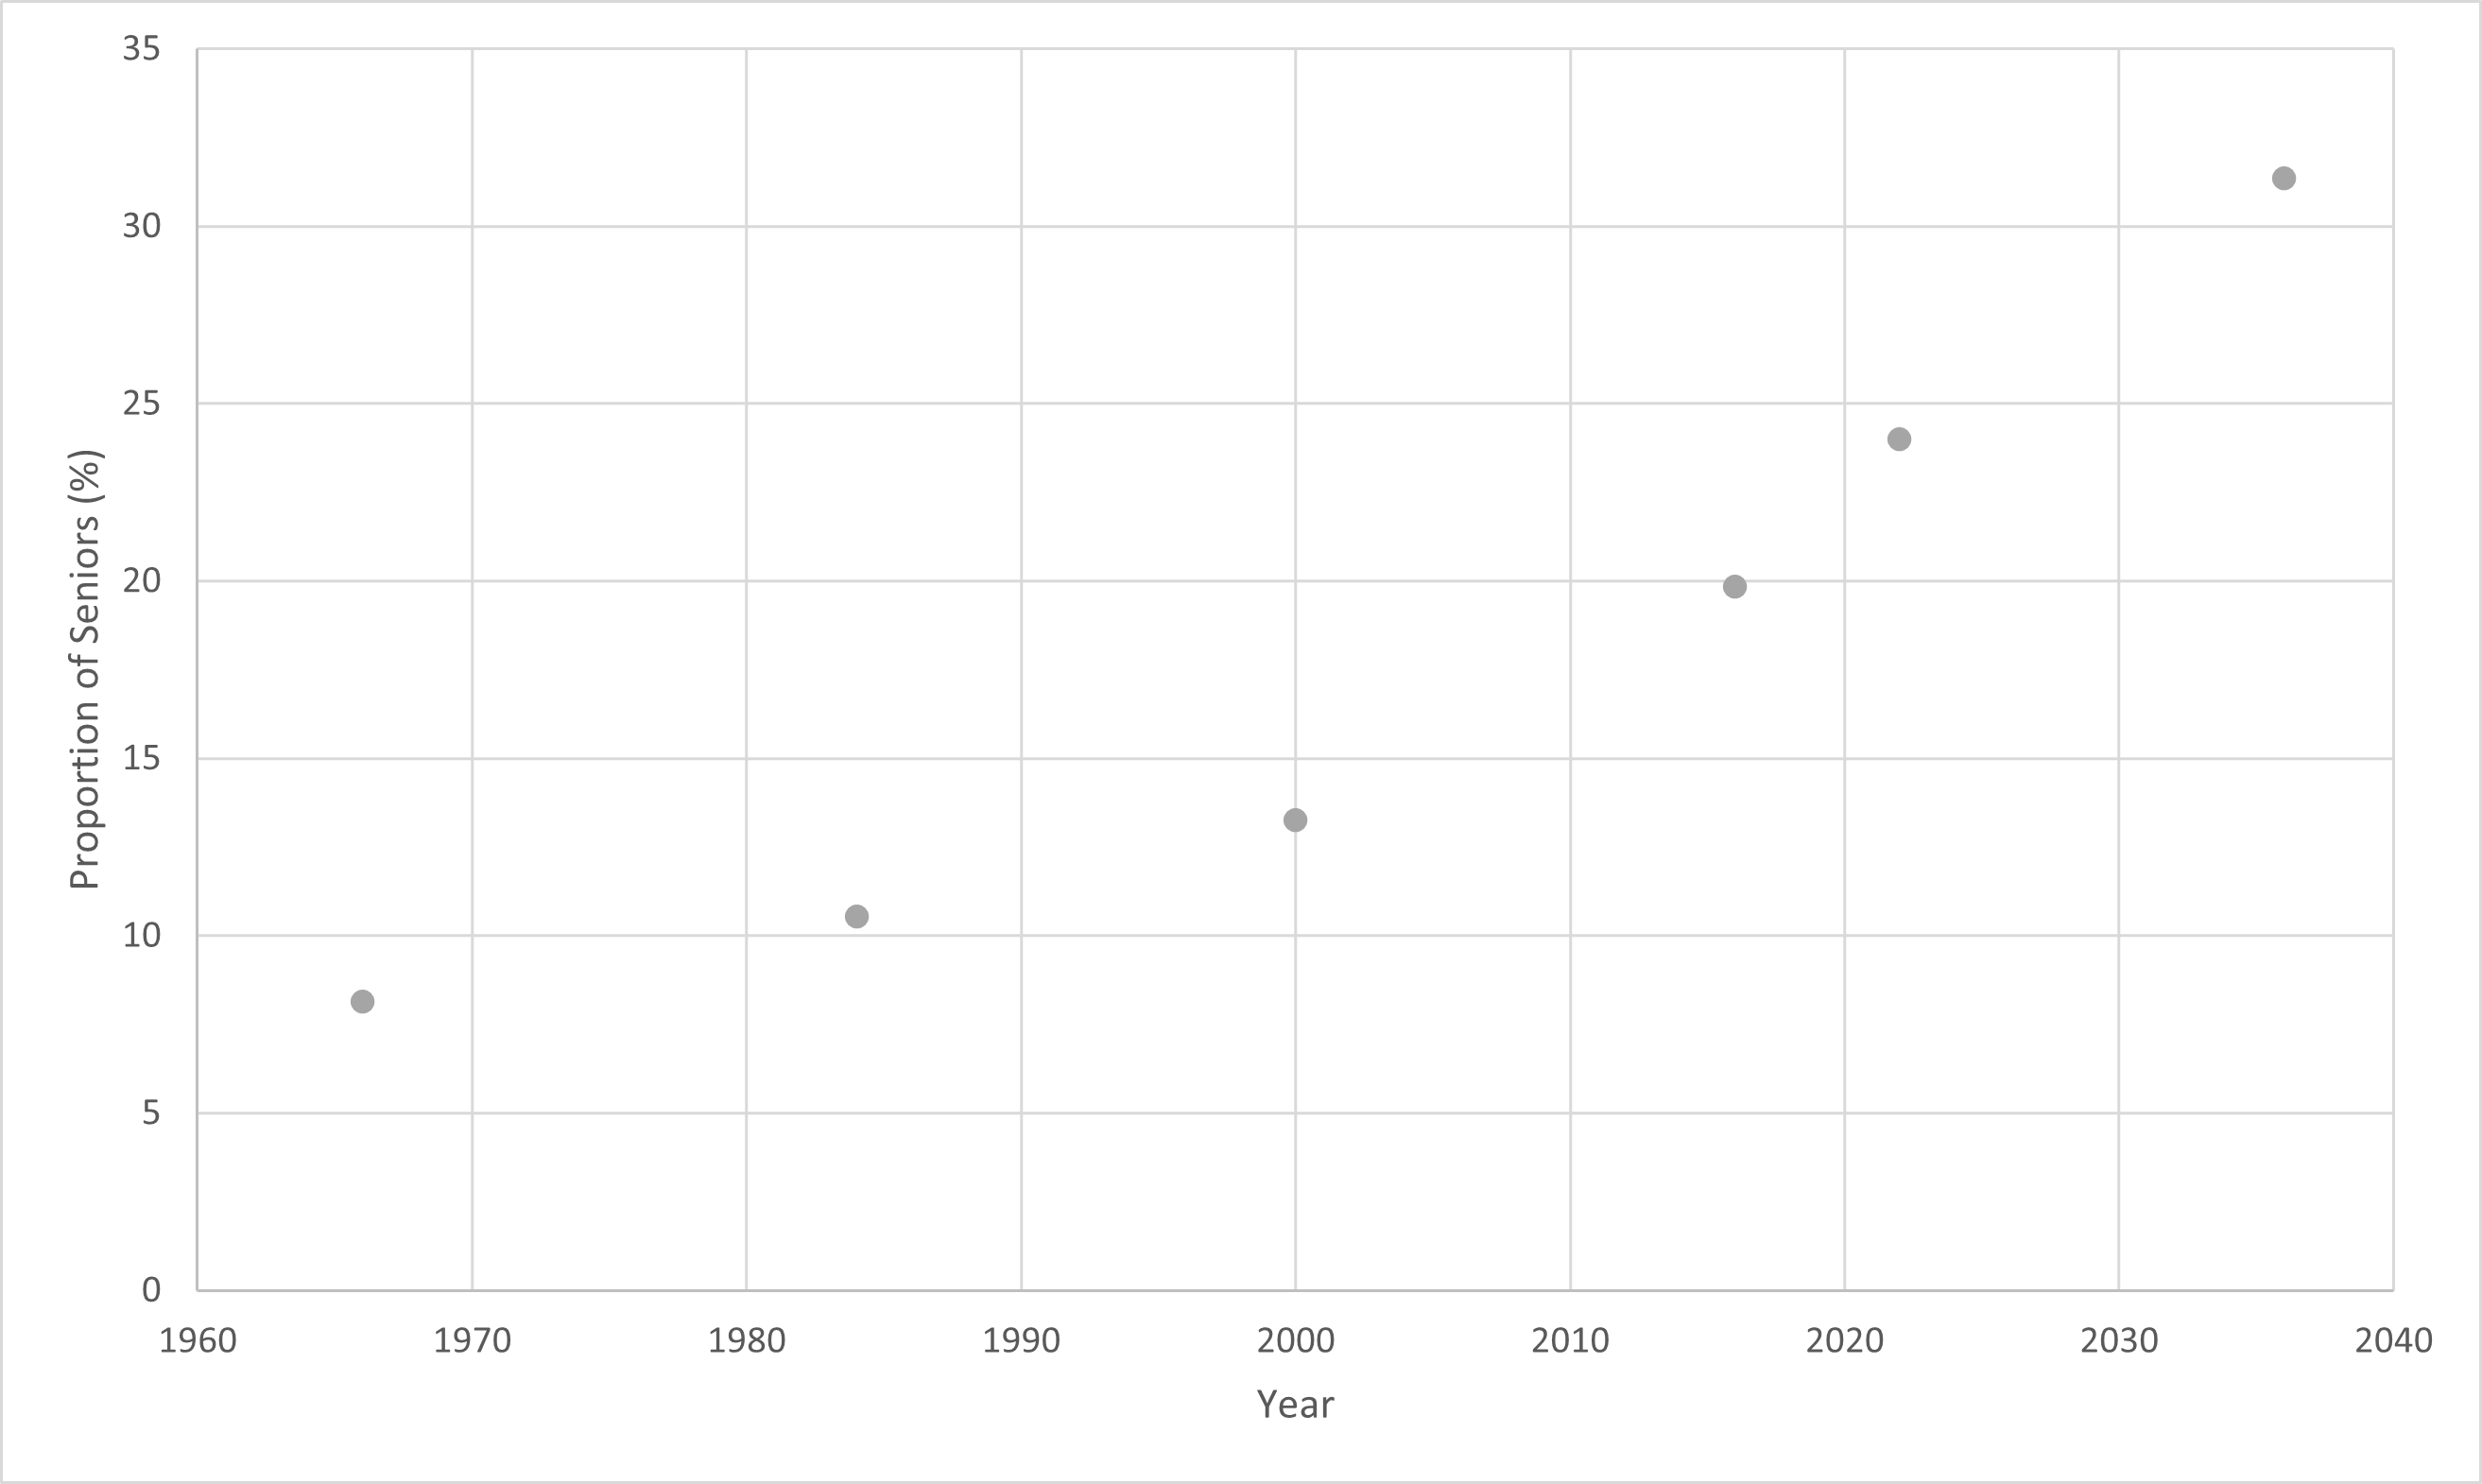
Using this tool, I plotted the proportion of seniors (averaged between men and women) for selected years in the past and the future. The Statistics Canada forecasts only go to 2036, but this proportion is still increasing by then in the extrapolation (In Factfulness, Hans Rosling pointed out that the aging of people already born is much easier to extrapolate than a lot of other trends). This proportion is around 3 times higher than it was when Medicare was introduced; in these projections it looks like it will increase almost as much in the next 10-15 years as it did in the previous. Which is likely to increase demand on the healthcare system faster than any plausible increases in funding can keep up with.
I also tried making my own basic demographic model (see the script at the bottom of this post), starting from the 2022 conditions in the medium growth scenario from Statistics Canada. I assumed 6200 or 8000 annual births and 7100 or 12800 annual net migrants (combined for migration within Canada and international migration, with an assumed average age of 40). Under these various scenarios, the average age in my model increased by 1.6 to 3.0 years over the next two decades. So looking at it a couple of different ways, an aging population is something we can expect to face for the foreseeable future. Eventually it should stabilize, but until it does, my expectation is that the strain on the healthcare system will continue to increase for the reasons outlined above (i.e. increased demand paired with relatively smaller working age tax base and recruitment pool).
An important caveat to this discussion of demographics is that New Brunswick has out-performed the projections on population growth since the last census—I'll be waiting to see when Statistics Canada can update their population pyramids with the latest data. Even the "high-growth scenario" had predicted a population of 775,000 by 2022, while in reality we've reached 797,000. I doubt it's been enough to halt the aging population trend, but probably does mitigate it at least somewhat.
Ideas
This section is just my brainstorming; I'm not a health policy expert by any means. In general, they revolve around ways to improve efficiency or divert some medical care (especially routine and low-risk stuff) away from the most bottlenecked parts of the system:
- Expanding e-health (e.g. consultations and routine prescription renewals via video chat) and extra-mural nursing.
- Maybe let people self-refer for some common/routine blood tests, where samples could be drawn at a pharmacy or a dedicated testing station.
- Expanded offerings (i.e. not just for coronavirus) of off-the-shelf/over-the-counter/at-home rapid antigen tests.
- My family had a great experience getting pregnancy and delivery care from a team of midwives. Expanding this service across the province seems like an obvious win as a way to divert low-risk pregnancies away from other medical resources.
- Anecdotally, I've heard that a lot of appointment slots at walk-in clinics are taken up with patients looking for renewals of opioid or benzo prescriptions. If these types of cases could be shunted to specialized clinics, it could free up more capacity at walk-in clinics for other needs.
- Centralized triage: a call-in/webchat service where an initial assessment can be made and the patient added to the queue but allowed to wait at home instead of filling up a waiting room if it is going to take several hours before they can be seen. This service could also tell the patient if they'd be better off visiting a walk-in clinic or a pharmacist than the hospital, depending on the nature of their medical need.
- Regional collaboration might have some benefits.
- Japan, ahead of most of the world on the aging population trend, is turning to a lot of automation and robotics to provide medical care for the elderly, as mentioned in this article (which also lays out "the trilemma facing ageing nations").
Miscellaneous Items and References
- Reorganizing local government to have a smaller (hopefully more manageable) number of local governments and local service districts is underway. Back in 2017, I noted that many New Brunswickers lived in unincorporated areas, but after this that will be true for far fewer people.
- Also from 2017, a little tally I did on the cost of housing in southern NB. Much has changed since then.
- A broader economic trend to watch: the cost of wheat has risen exponentially recently (largely due to the war in Ukraine); compare the graph 3/4s of the way down this post from 2014 to put it in context.
- Inflation and rising interest rates are going to be a factor that affect all budgets (including but not limited to those of provincial governments) for the foreseeable future, I expect. Next year maybe I'll try to analyze how they're impacting NB's finances.
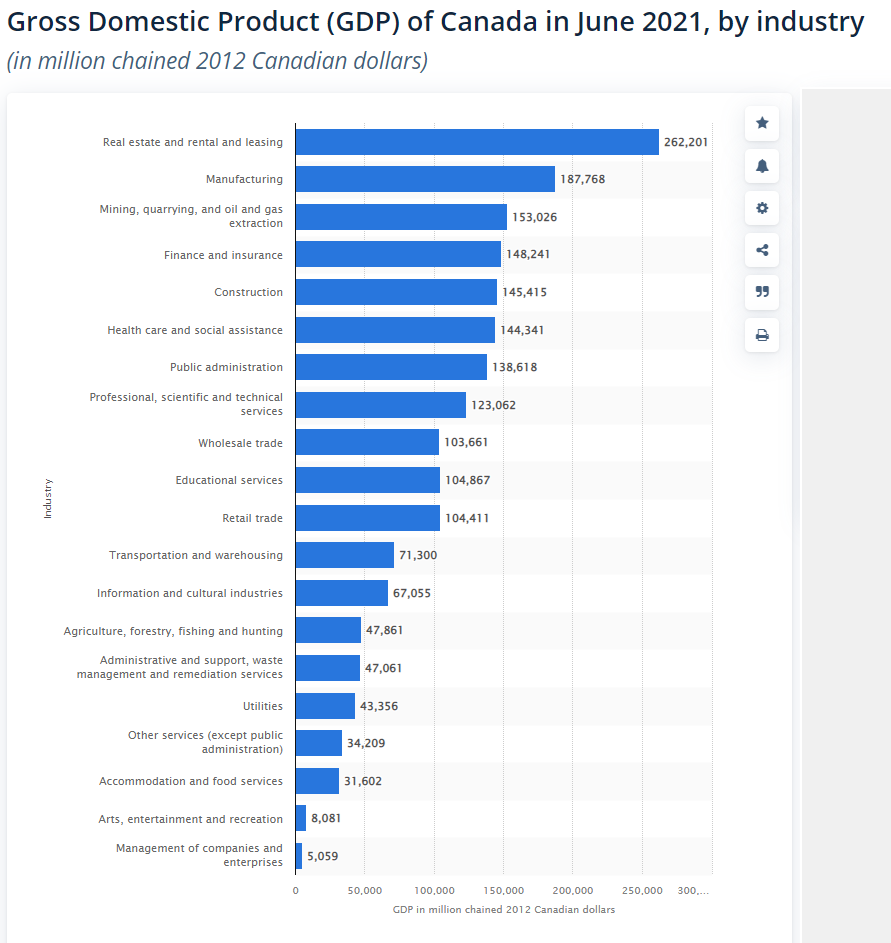
- As the following graph shows, healthcare is the sixth largest sector of the Canadian economy—and the highest ranked one that mainly is a government expenditure rather than mainly a source of public revenue. A decline in some of the sectors above it (i.e. our top five) would hamper the ability to pay for it. (The impact of Real Estate being far and away the largest part of our economy on housing affordability is left as an exercise to the reader).
Links:
- Main Budget Document
- New Brunswick Economic Dashboard (gnb.ca)
- Canadian Institute for Health Information (CIHI) page on New Brunswick
- A post I made last year wondering about the future of equalization payments
Here is the code for the simplified demographic model I mentioned above:
(ns pop-pyr)

(def initial-pyramid [6760 6850 6925 7005 7075 7150 7220 7265 7335 7460
7570 7675 7770 7870 7860 7670 7525 7395 7615 7625
7535 7520 7765 7470 7595 7490 7715 7960 8105 8330
8610 8890 8925 8645 8515 8535 8630 8740 8840 9055
8985 9020 9015 8860 9135 9645 9665 9885 9870 10155
10410 10590 10425 10340 10505 10790 11520 12340 12595 12630
12590 12475 12405 12035 12240 12085 11490 11535 11045 10620
10135 9690 9620 9455 9245 8980 7415 6625 6320 5830
5320 4960 4355 4040 3530 3145 2885 2570 2245 2025
1830 1450 1190 950 790 585 455 330 230 170 280]) ;; from 2022 medium growth scenario

(def survival-by-age [0.9944365 0.99961302 0.999764013 0.999820008 0.999854505
0.999868006 0.999877007 0.999885007 0.999892506 0.999900503
0.9999035 0.999896001 0.999869509 0.999820527 0.999753055
0.999679592 0.999604141 0.999523211 0.999437806 0.999350936
0.999258604 0.999167813 0.999092049 0.999036792 0.998996035
0.998960285 0.998920047 0.998875316 0.998821577 0.998761331
0.99869858 0.998637327 0.99857409 0.998511879 0.998447702
0.998377546 0.998302416 0.9982283 0.998158201 0.998086636
0.998004629 0.99790769 0.997795781 0.997665893 0.997516557
0.997346321 0.99715176 0.996930437 0.996678456 0.996394333
0.996083522 0.995740584 0.995354706 0.994920976 0.994442958
0.993928183 0.993384693 0.992813539 0.992218818 0.991597637
0.99091253 0.990184178 0.989472782 0.988798048 0.988119983
0.987349957 0.986455436 0.985470469 0.984384857 0.983162861
0.981734816 0.980082142 0.97823161 0.976170706 0.973852511
0.971124432 0.967997519 0.964601254 0.96094993 0.956915179
0.952235091 0.946815972 0.940750106 0.934001572 0.926456642
0.917978882 0.908451453 0.897790349 0.885948204 0.872911959
0.858686342 0.843291198 0.826756359 0.809122689 0.790439356
0.771785903 0.75348123 0.735857273 0.719253689 0.703999885 0.687818713]) ;; from US actuarial tables

(def ages (take 101 (iterate inc 0)))

(defn total-pop [pyramid]
  (reduce + pyramid)
)

(defn avg-age [pyramid]
  (float (/ (reduce + (map #(* %1 %2) pyramid ages)) (total-pop pyramid)))
)

(defn next-yr [pyramid]
 (vec (map #(int %) (concat [6200] (reverse (drop 1 (reverse (map #(* %1 %2) survival-by-age pyramid)))))))
)

(defn immi [pyramid]
  (assoc pyramid 40 (+ 7200 (pyramid 40))) ;; add annual immigrants at their avg age
)

(loop [year 2022, pyr initial-pyramid]
  (if (< year 2100)
    (do
      (println [year (avg-age pyr) (total-pop pyr)])
      (recur (inc year) (immi (next-yr pyr))) ;; increase the year and calculate the next year's pyramid
    )
    (println "done")
  )
)