NB Budget 2019 - We've got the power?
I've written an analysis of the New Brunswick provincial budget for the past four years now. As always, my goal is to focus on the facts more than on political commentary. Following the regular look at the budget, this year's post features a deeper dive into the crown corporation of Énergie NB Power.
I'll start with a few things to keep in mind while reading this post:
- The federal budget also came out today, but there are lots of other places you can read about it
- New Brunswick currently has a minority government, which makes the budget more of an exercise in compromise than it otherwise would be
- The capital budget was already released and included newsworthy items like putting projects on hold to renovate the Centennial Building in Fredericton as a new courthouse and building a new home for the NB Museum
- I try to keep most of the amounts in millions (M) of dollars (CAD) because I think it's easier to compare than mixing million and billions
- The fiscal year doesn't line up with the calendar year, so this is officially the 2019–2020 budget, but I'll mostly refer to it as the 2019 budget to be concise
Where Things Stand
To start with, here are some of the key estimates in the provincial budget for the fiscal year ahead:
- Projected total revenues of $9846M
- Projected total expenditures of $9823M
- A projected surplus of $23M
- Projected net debt of $14056M this time next year
As this article covering the budget notes, this is the first time in 13 years that the provincial government is budgeting a surplus. However, there was actually a tiny surplus ($4.5M) in the fiscal year that just ended. There had been a deficit of $189M forecast, but revenues came in higher than expected (so did expenses, but the increase in revenue was greater). As far as I can see, the big difference between what was budgeted and what was received came from income and property taxes; I'm not aware that any rates went up so this is probably due to an increase in the size of the tax base (i.e. amount of income reported in the province and assessed values of homes).
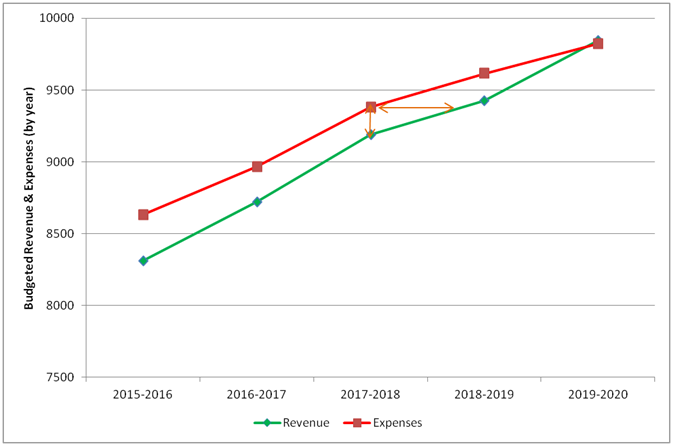
The following graph shows the expenses and revenues forecast (to be consistent, I'm using the projected values from the start of each fiscal year not the actual values from their ends) in each budget since I've started blogging about them. The deficit (or surplus, depending on the direction) is the gap between the expenses and revenue illustrated by the vertical line. I've also added a horizontal line to illustrate a different way of looking at the deficit: as a time lag before revenues catch up to expenses. For the past five years I've been following it, this gap has only been around a year, meaning the deficit could have been eliminated sooner simply by slowing the growth of spending.
The departments with the largest budgets for the upcoming fiscal year are as follows (these figures and the following graph are for their ordinary accounts which don't include capital spending, amortization, etc.):
- Health: $2803M
- Education and Early Childhood Development: $1295M
- Social Development: $1235M
- General Gov.: $858M
- Debt Service: $677M
- Post-Secondary Education, Training, and Labour: $636M
- Transportation and Infrastructure: $312M
- Public Safety: $227M
There has been no change in the rankings of these major departments since the last budget. Public Safety has been reorganized, though, and is now separate from the Justice Department.
The next graph shows the budgeted expenditures by department (if you're comparing this to a similar-looking graph in my post from last year, note that that one was of year-over-year change in spending) with the change from how much was spent (actually spent, not budgeted) from last year noted.
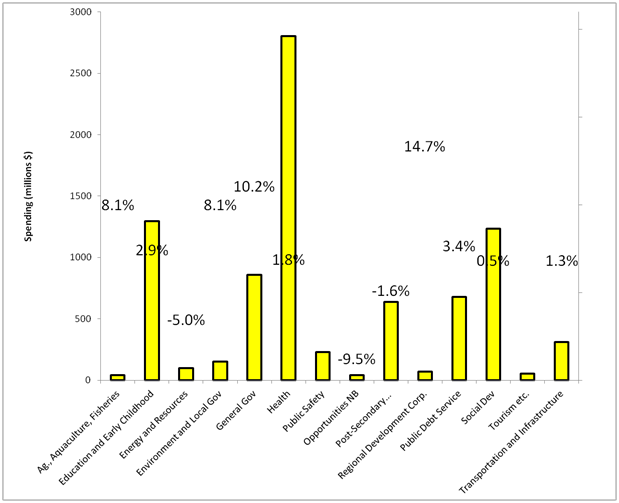
The largest change was in public safety. Last year they had a budget of $12M for security and emergencies but spent $87M (I assume for things like the flooding and the fatal shooting of 2 police officers in Fredericton). The departmental budget for 2019 is in between what was budgeted last year and what was actually spent.
In terms of departments and agencies aimed at developing the provincial economy, there were cuts to Opportunities NB and Tourism, but an increase to the Regional Development Corporation.
The budget for the department of Social Development increased, but only by 0.5% (less than inflation). Within this department, funding for seniors and long term care increased from $526M to $547M but funding for income security and housing services both decreased (by $6M and $9M, respectively).
Moving to the revenue side of the 2019 budget, the major anticipated sources of revenue for the Government of New Brunswick include:
- Taxes: $4791M
- Equalization payments: $2023M
- Other grants from the Federal Government: $1462M
- Other self-generated revenue (Licenses, Royalties, Lottery, Etc.): $1192M
The next graph shows the budgeted revenue by source with the change from last year (actual, not budget) noted:
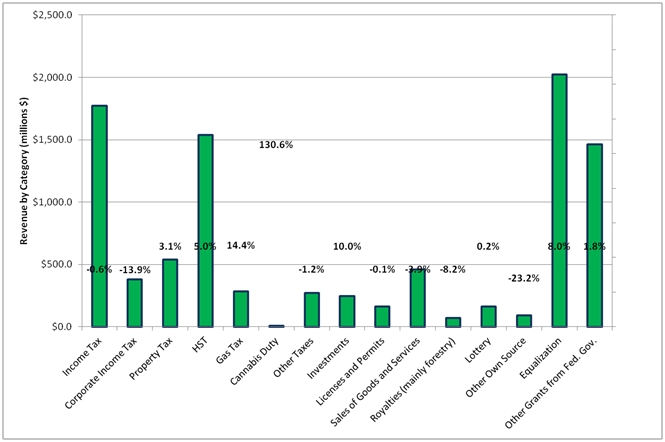
I'm not aware of tax rates that are going to be changing, so I don't know why revenue from corporate taxes is projected to decrease while revenue from the HST is projected to increase. My assumption would be that these projections are based on economic forecasts for the province (e.g. decreased net revenue for New Brunswick corporations, increased consumer spending) but I don't know for sure. The change in the gas tax revenue is explained in the next section. The change in Investment revenue appears to be based on hoping that NB Power recovers from a bad year (only $14.7M in actual revenue last year, and $37.7M projected for the year ahead).
In light of my last post, it's perhaps interesting to point out that the provincial government received $0.43M in royalties on sand and gravel (almost as much as for natural gas).
Updates
Here are a few quick notes on points I've discussed about the provincial budget in the past:
- Revenue from marijuana duties was projected to be $6M but was only $3.6M; I assume the main factor behind this difference was the change in the official legalization date. The projected revenue for this fiscal year is $8.3M.
- Last year a portion of the gas tax was re-designated as a climate change fund. This year it has been un-designated as such; $37M gets moved from one line item to a different one but I don't think it will actually change the price paid at the pumps. (clarification: it won't affect provincial taxes at the pumps but the Federal carbon tax is rolling out in April).
- If you want to know more about equalization payments, here is an explainer I came across.
- Last year I alluded to demographics in the context of the provincial education system, but the aging population in the province affects so many other things. I might try to delve into this more next year, but for now I'll just recommend this as a good read on the subject.
Crown Corporations in New Brunswick
Crown corporations have a board appointed by the government but operate at arm's-length. Based on this list the Crown corporations in the province include:
- Economic and Social Inclusion
- Opportunities NB
- Regional Development
- Service New Brunswick
- New Brunswick Community College (including English and French institutions)
- Financial and Consumer Services Commission
- NB Power
- NB Research and Productivity Council
- New Brunswick Investment Management
- NB Liquor—Cannabis NB is a subsidiary corporation
Add to the above the Health networks (Horizon and Vitalité) and Ambulance New Brunswick and a share in the Atlantic Lottery Corporation. As far as I understand, only a few of these (NB Power and NB Liquor, at least) are intended to provide a return on investment to the general provincial budget while the others are supposed to operate as not-for-profit corporations.
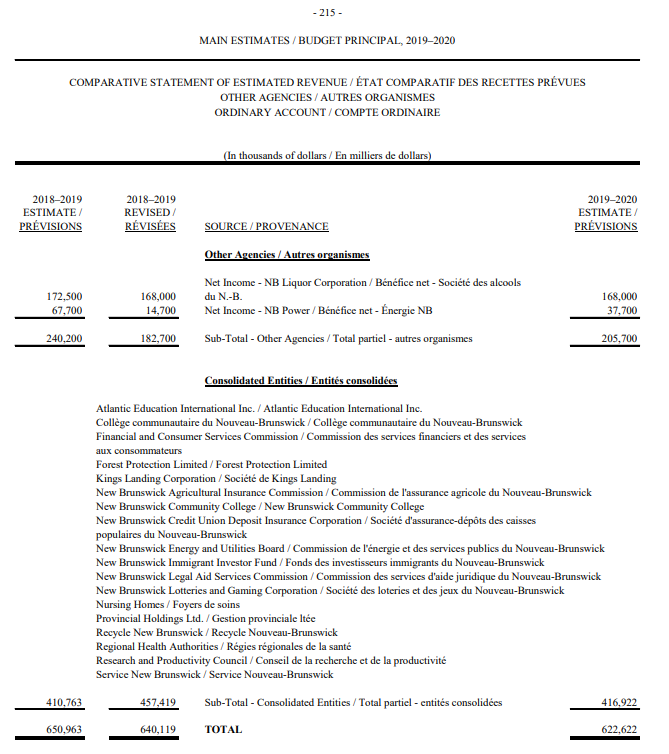
This page from the budget document reports revenue from these corporations/agencies:
NB Power
For the remainder of this post, I want to focus on the Crown corporation of NB Power. It has a portfolio of electrical generation, transmission, and distribution assets that includes:
- Almost 7,000 km of transmission lines with the ability to import/export over 2,000 MW from/to neighbouring provinces and states
- Over 21,000 km of distribution lines
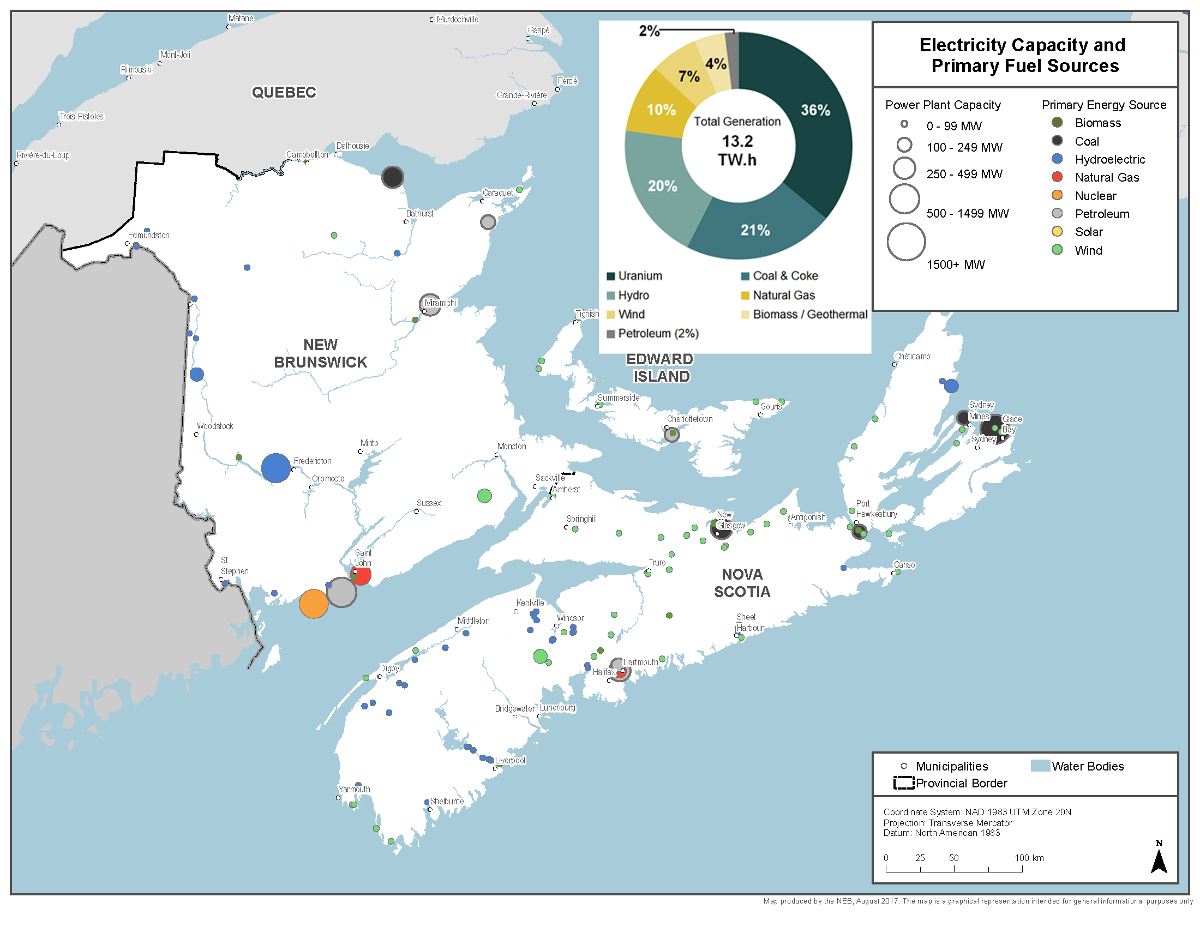
- The nameplate capacity to generate around 3,500 MW from a diverse set of power plants that includes nuclear, hydroelectric, and thermal and combustion (these categories both use fossil fuels but have different kinds of turbines)
- Power purchase agreements that add an additional 735 MW of nameplate capacity (from sources including wind, natural gas, biomass, and hydroelectric)
This figure shows a map of electrical generation capacity in the Martime provinces, with an inset pie chart of the composition of the power sources in New Brunswick (both images are from the National Energy Board; I just combined them for the purpose of this discussion):
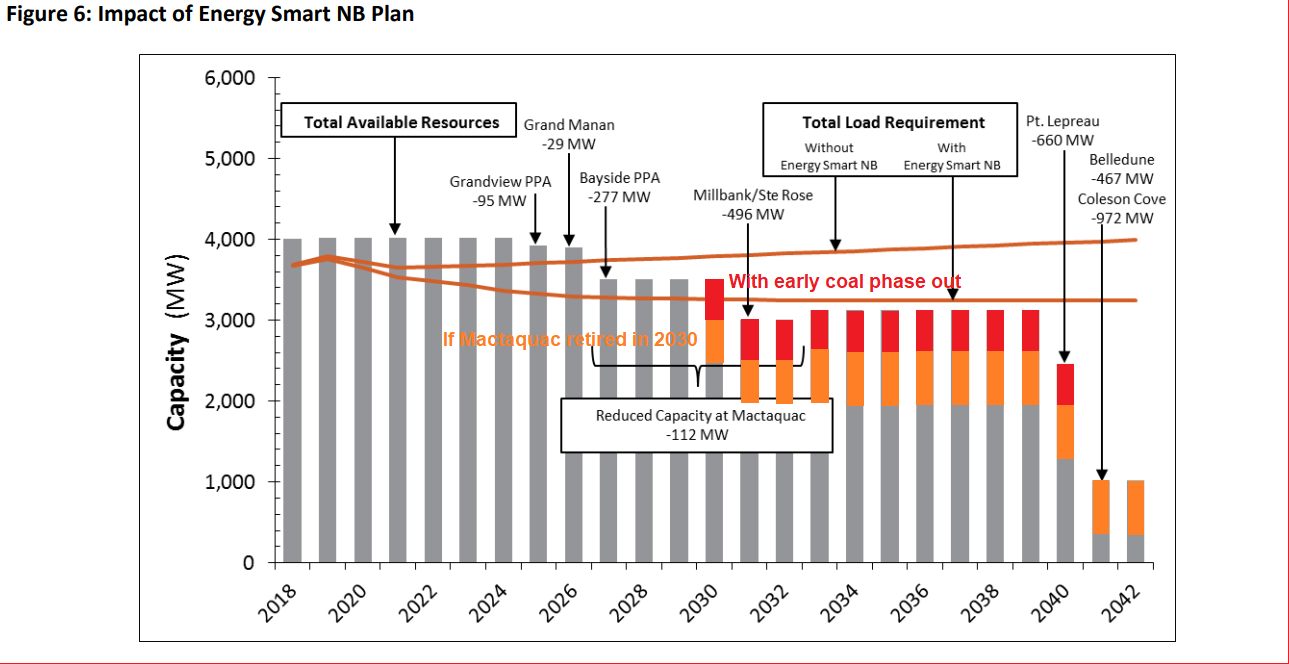
The next figure comes from NB Power's 10 year plan and shows how generating capacity is expected to change over time. This is based on making some repairs to the Mactaquac dam to extend its life (with 1 out of 6 turbines out of service annually for 6 years starting in 2027 while repairs are made). It's also assuming that coal plants (Belledune has a capacity of 467 MW) can continue to be operated until 2040. However, there may be a requirement to phase out coal by 2030 to reduce greenhouse gas emissions so I coloured part of the bars red to indicate what would be subtracted if this capacity was lost a decade earlier than planned. I also coloured part of the bars orange to indicate what would be subtracted if Mactaquac dam was closed in 2030, which was one of the options considered for it. As the figure shows, NB Power is assuming the "Energy Smart NB" program can reduce/stabilize the demand for electricity. However, if coal is phased out early (and/or if the decision had been made to close Mactaquac dam in 2030) then there would be a gap in capacity to make up almost a decade earlier than planned.
In the 2017–2018 fiscal year (the most recent annual report is not available yet), NB Power had 17 billion kWh available for distribution (6.6 billion kWh were purchased). Of this, around 13 billion kWh was sold in the province and 3.5 billion kWh was sold via interconnections to other jurisdictions. They received $1754M in revenue. Expenses included $727M for the purchase of fuel and electricity, 477M for operations (including maintenance and administration), and $264M for finance costs (mainly interest on debt), among other things. Their net earnings were $23M. The total net debt at that time was $4767M; their capital structure comprised 93% debt—one of their objectives for the future is to lower that ratio. According to the New Brunswick AG, "NB Power is supposed to be an independent company, and its assets, liabilities and debt are not on the province's books."
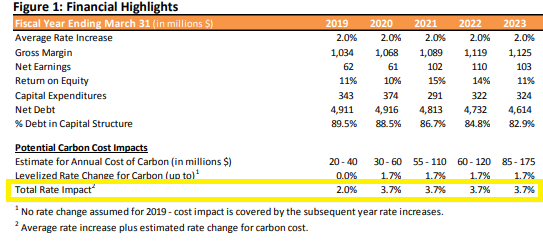
If you are a customer of NB Power, this table from the 10 year plan will be of interest. It looks like rates will increase by 3.7% annually after this year (see the highlighted box)—2% from general inflation plus 1.7% for the roll-out of the carbon tax (which increases in $10/tonne CO2e increments until 2022 and the NB Power rate increases lag by a year).
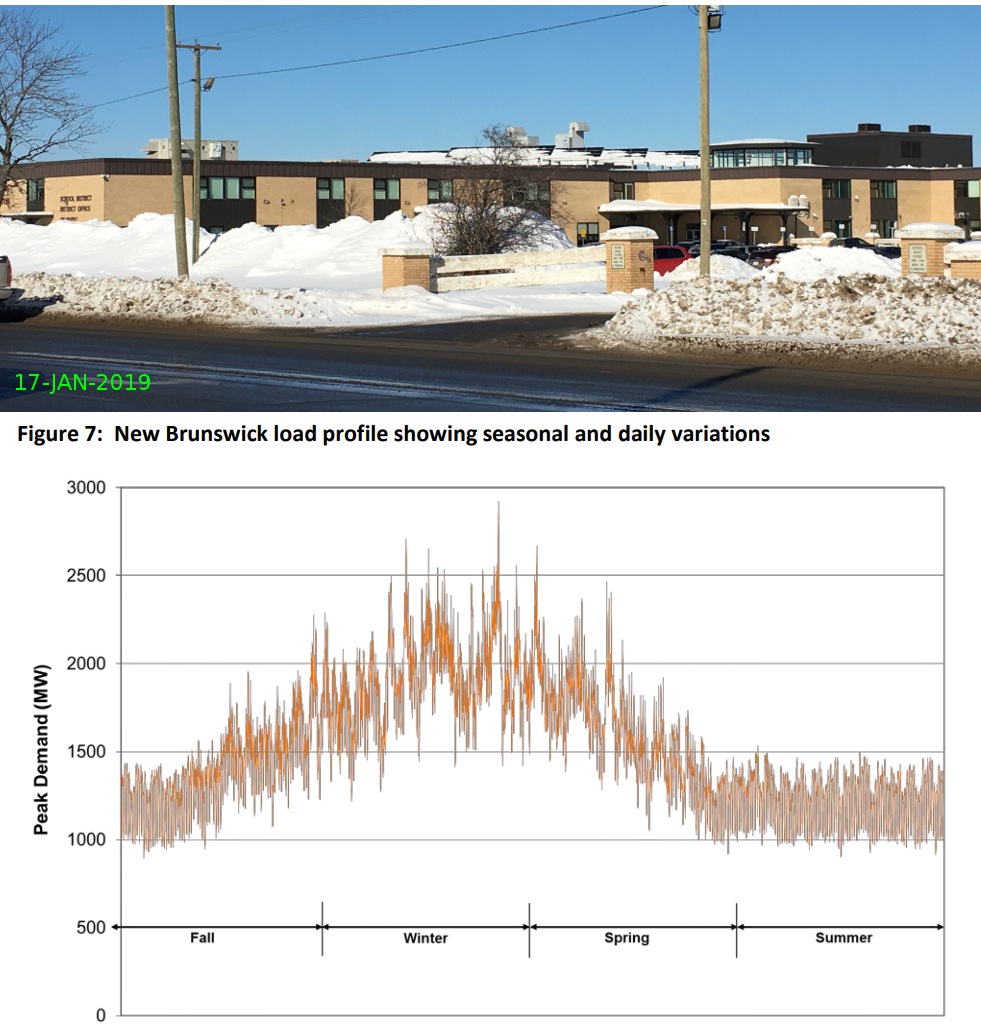
Finally, it's not owned by NB Power, but I wanted to share this photo of solar panels on the roof of Fredericton High School (apparently the province spent around $0.5M on them). When driving past them after some storms this winter, I sometimes noticed they were covered in snow (they didn't spend all winter like this, to be clear). The other part of the following image is a chart from NB Power's Integrated Resource Plan showing how the demand for electricity varies throughout the year. A source like this that is not available when it's needed most is not ideal (this is not a knock on solar power in general, just pointing out that forms of renewable energy should be used where they make the most sense; this map, for example, shows strong trends in what types of renewable energy are installed in which region of the US (e.g. solar in the southwest, wind in a corridor from the Gulf of Mexico to the Great Lakes)). Wind power—NB Power currently has power purchase agreements in place for almost 300 MW of installed capacity—and nuclear are more promising sources of clean energy here, in my opinion.
References
- Main budget document
- Stats from the National Energy Board
- 2017 – 2018 NB Power Annual Report
- NB Power Integrated Resource Plan
- NB Power 10 Year Plan
- Other annual reports and strategic plans for NB Power are also available online