NB Budget: Full Circle
My tenth year doing this feature!
This marks the tenth year that I've written up an overview of the provincial budget. I've decided that this is probably a good point to wrap this series up (at least for the time being), so this post will look back at the trajectory of the debt and some things I've learned from going through the exercise ten times. (By the way, I published another post just a few days before the provincial budget was released; here is the link if you missed it and are interested).
Introduction
The previous nine posts in this series can be found in the following links. Each one looks at the budget for the fiscal year starting just after it was published (I believe April 1st is the start of the fiscal year for the provincial government). The numbers in each post reflect what was planned; however, since plans for the following year reflect what actually happened in the previous year, the long-term trends should be fairly close (i.e. the numbers I've recorded for the provincial debt are the end-of-year projections, which might have been a bit off in any given year, but the multi-year trend should be pretty close to what actually happened since these projections get updated each year). Many of these posts also analyze a specific topic or department, indicated by the URL.
- https://danbscott.ghost.io/nb-budget-2015-by-the-numbers/
- https://danbscott.ghost.io/nb-budget-2016-in-context/
- https://danbscott.ghost.io/nb-budget-2017-looking-local/
- https://danbscott.ghost.io/nb-budget-2018-getting-educated/
- https://danbscott.ghost.io/nb-budget-2019-weve-got-the-power/
- https://danbscott.ghost.io/nb-budget-2020-is-demographics-destiny/
- https://danbscott.ghost.io/nb-budget-2021-damage-report/
- https://danbscott.ghost.io/nb-budget-2022-staying-healthy/
- https://danbscott.ghost.io/nb-budget-2023-healthcare-redux/
As per usual, I'll try to keep most of the amounts in the discussion below in millions (M) of dollars (CAD) because I think it's easier to compare than mixing million and billions. And while I'll mostly refer to it as the 2024 budget, it is technically for the 2024-2025 fiscal year.
Here are the sources I used for this post:
- Main budget document
- News coverage
- Provincial economic dashboard (for population and GDP numbers; it also has stats on things like housing starts)
2024 Budget by the Numbers
To start with, here are some of the key estimates in the provincial budget for the fiscal year ahead:
- Projected total revenues of $13296M
- Projected total expenditures of $13255M
- A projected surplus of $40.8M
- Projected net debt of $12678M this time next year
The net debt by the end of the fiscal year will represent around 27% of provincial GDP. Note that it is increasing in spite of the surplus in this budget due to the capital budget (a separate document that I haven't been reviewing).
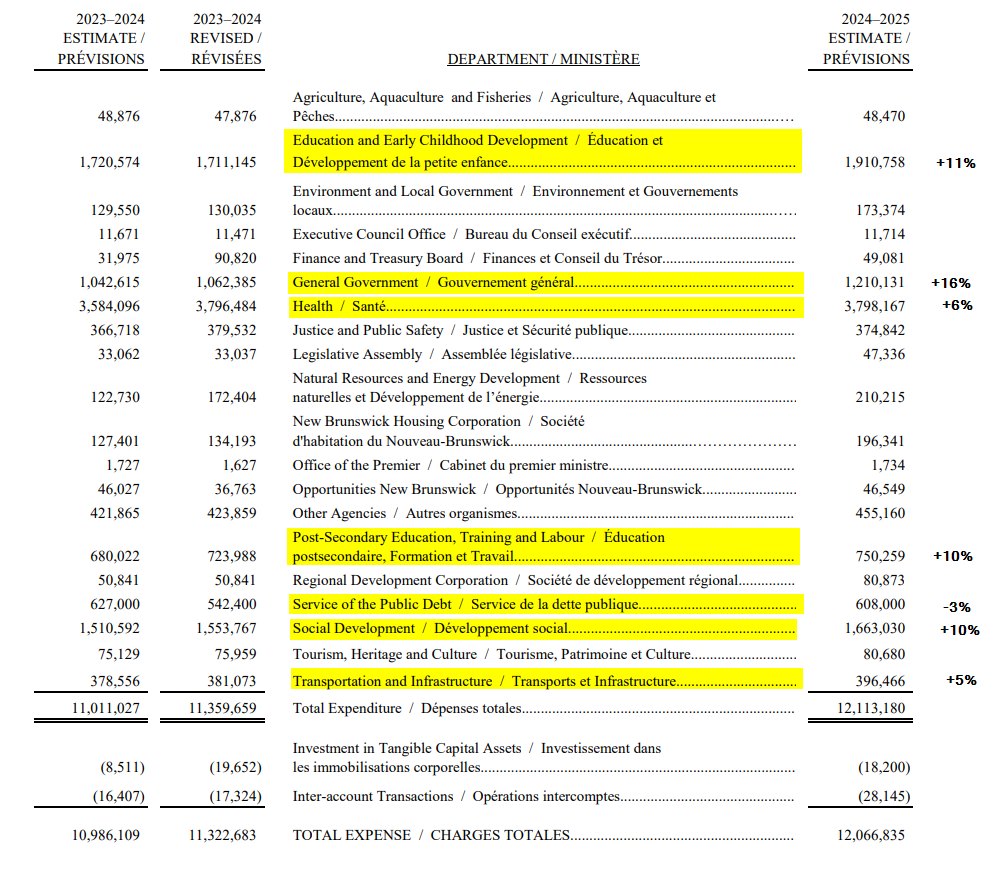
The departments with the largest budgets for the upcoming fiscal year are as follows (these figures and the following graph are for their ordinary accounts which don't include capital spending, amortization, etc.):
- Health: $3798M
- Education and Early Childhood Development: $1911M
- Social Development: $1663M
- General Government: $1210M
- Post-Secondary Education, Training, and Labour: $750M
- Debt Service: $608M
- Transportation and Infrastructure: $396M
- Public Safety: $375M
In the following excerpt from the budget document, I've highlighted the biggest expenses and also indicated the percentage increase (or decrease, in the case of the debt service) from what was budgeted last year.

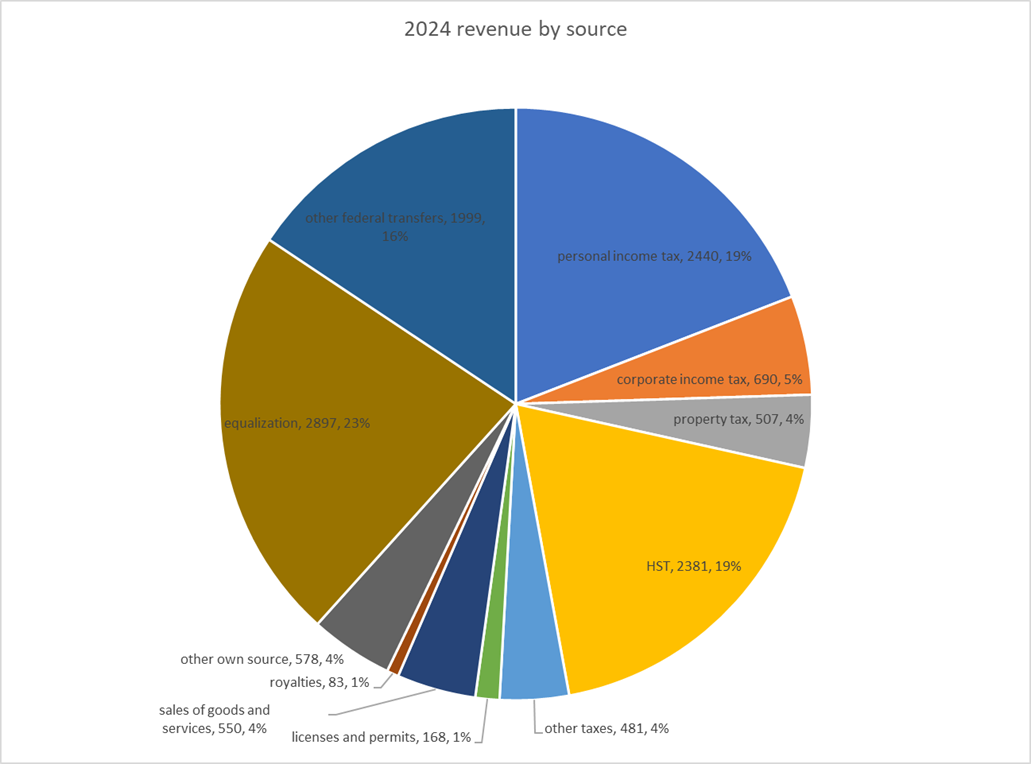
On the revenue side of the 2024 budget, the major anticipated sources of revenue for the Government of New Brunswick include:
- Taxes: $6499M
- Equalization Payments: $2897M
- Other grants from the Federal government: $1999M
- Other self-generated revenue (Licenses, Royalties, Lottery, Etc.): $1379M
Here is a pie chart of the various sources of revenue:

Decadal Trajectory
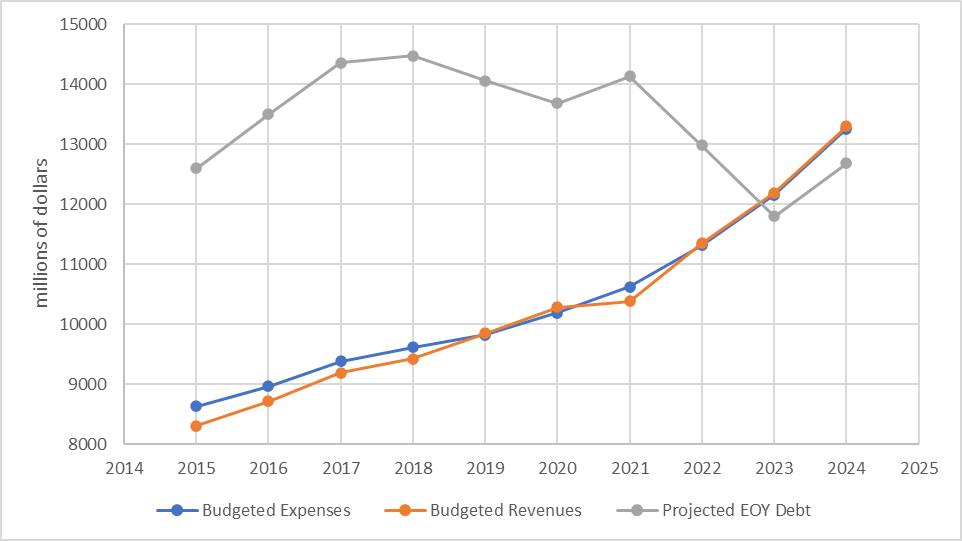
For this tenth and final post in this series, I went back through the previous posts and charted the revenue, expenses, and provincial debt from each year's budget. As noted in the introduction, what actually happened in any year may have differed a bit from what was in the budget, but the long-term trends are pretty close:

Coincidentally, the debt is basically back to where it started, in nominal terms anyway. However, from most other ways of looking at it, we're much better off:
- $12600M in 2015 would be $15955M in 2024 after adjusting for inflation; the current debt forecasted for the end of the fiscal year ahead is $3277M less than that
- In per capita terms, the 2015 debt was $16,733 (just dollars, not millions). The 2024 per capita debt is $15,039, which is a 10% improvement.
- Relative to GDP, the provincial debt in 2015 was 39% and in 2024 it's 30% (the latest GDP data I could find was from 2022; I assume the provincial government has more up to date numbers that are giving them 27% as stated above).
- Relative to annual revenues, the debt in 2015 was 152%, whereas now it is less than annual revenues, at 95%.
(GDP was $32 billion when I started writing this series (according to my first post), and the population at the time was around 753,000. Now the GDP is $42 billion or more (the latest data currently available is from 2022 and it was reported in chained 2017 dollars so I adjusted it for inflation). The population has increased to around 843,000. This is a 31% increase in (nominal) GDP and a 12% increase in population.)
The first few years I did this series of posts, the provincial debt increased by an average of around $620M per year. If this trajectory had continued, we'd now be over $18,000M in debt, or 42% higher. That means the annual debt service would be at least $863M, an extra $255M per year that wouldn't be available for spending on other priorities. In fact, it would probably be higher than this, as the higher debt load would lead to a lower credit rating and thus higher interest rates.
Retrospective
Looking back on ten years of writing this provincial budget review post, there are a couple of things I learned that I wanted to share:
- Governments don't budget from scratch. Rather they take the budget from the previous year and tweak it, usually just by single digit percentage points (at least for the larger departments; a small department might have its budget change by tens of millions from one year to another, which is much higher percentage-wise than even hundreds of millions for the largest departments). Outright cuts are rare (again, at least for the largest departments), so instead the main decision is how to allocate annual increases. Basically, there's a ton of path dependence involved.
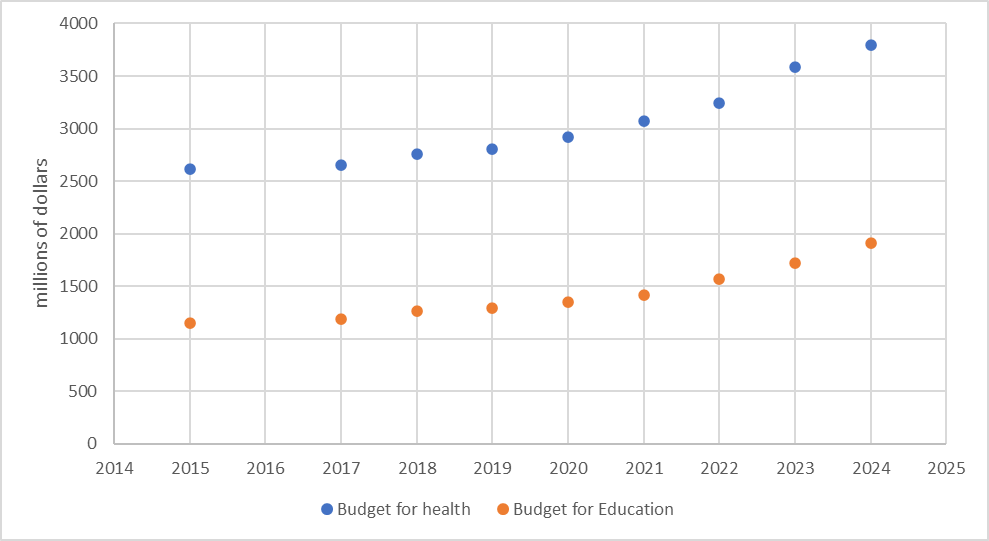
- Something that has become a pet peeve of mine since looking at these numbers annually is when people complain about cuts to healthcare or education. This is simply not factual. Their budgets have increased every year for the past decade (and probably more, I just don't have the numbers in front of me further back). When I looked at it in 2022, even metrics like doctors per capita were up. And yet these services obviously feel strained. In the case of healthcare, no doubt a large part of this is simply rapid growth in demand as our population ages. For education, maybe we need to question whether inclusion policies and their impact on classroom complexity are an effective way to deliver education. Other than that, it probably bears looking into whether increased administrative overhead is leading to less time for staff to spend with patients/students.

Looking Ahead
I also wanted to share a few things that are on my radar regarding our economic and fiscal situation:
- First of all, equalization payments are a big part of provincial revenues (23% this year). I wrote about them in this post. I've expressed concerns in the past that increasingly-adversarial federal-provincial relations could put these payments in the crosshairs. Obviously, any reforms to the equalization formula that left New Brunswick with less would be very challenging for our budget.
- Relatedly, there are concerns (although the headline is surely hyperbolic) at a national level about the interplay between economic stagnation and political unrest.
- One trend that has wide-reaching effects is our aging population. Among other impacts, this increases demand for certain services, decreases personal income tax revenue, and puts pressure on pensions. Thanks to population growth that we've finally seen in the past few years, we're still facing this issue, but now probably won't hit it faster or harder than most other jurisdictions. And we've already been through contentious/controversial alterations to public sector pensions that a lot of jurisdictions will be facing to keep them solvent so in that sense might be ahead of the curve.
Indeed this is an issue that many locales are facing, as the following videos make clear:
A book I read last year, Growth by Vaclav Smil, also touched on this topic (among many others—I hope to write more about it later this year):
[A]n aging population and shrinking labor force bring reduced social benefits, higher taxes, and lower disposable income, conditions when not only having children but even getting married becomes an unaffordable option [thus becoming a low fertility trap] (p.323)
[Dependency] ratios will commonly double in affluent countries during the first half of the 21st century, threatening to bankrupt the existing pension plans unless higher contributions or lower payments are enacted soon; and there will be unprecedented demand for geriatric health care. (p.431)
Implications of aging societies include concerns around,
security of pensions, provision of adequate health care, coping with unprecedented numbers of mentally ill old people, and maintenance of expansive infrastructures (p.471)
While I'm not intending to continue this annual provincial budget review feature, if you've found this series worth reading, I hope you'll check back occasionally for the other things I write about!